If you need a custom map for your story, blog, or website, contact us because we offer a limited number of free custom maps on a first-come, first-served basis! See our Featured Maps for inspiration.
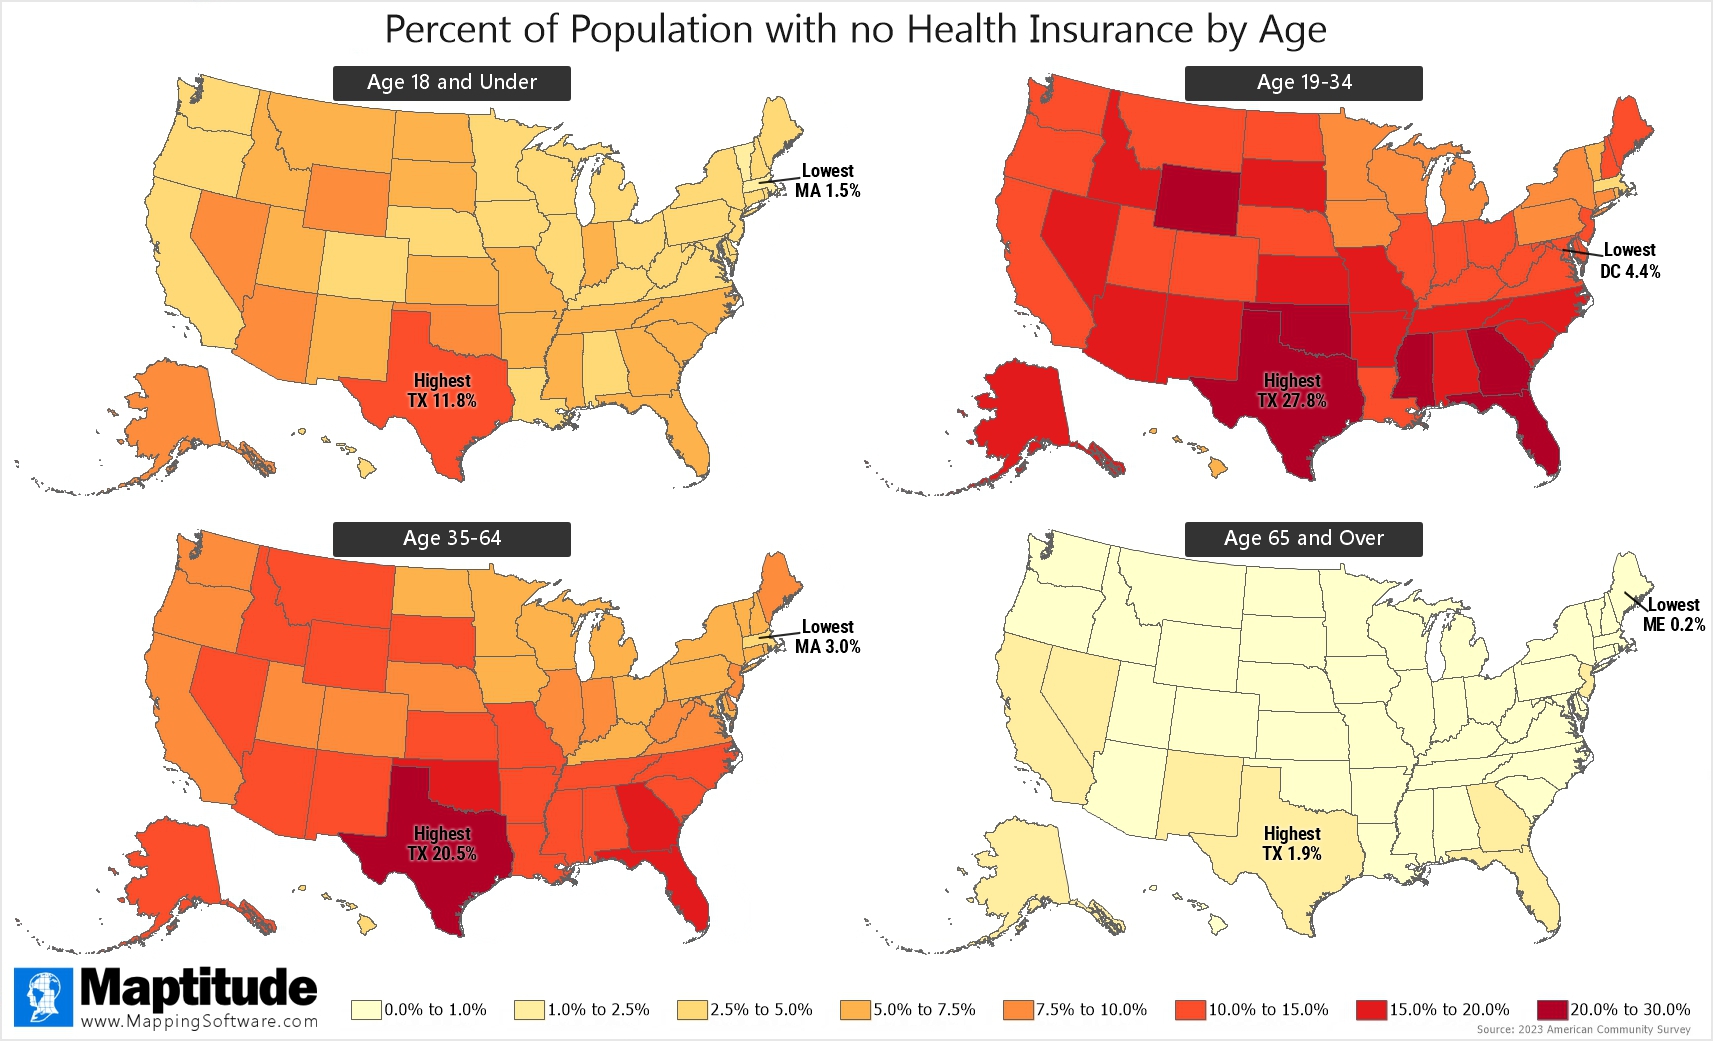
Maptitude is the best mapping software for business intelligence! The Maptitude 2025 U.S. Country Package includes data on types of health insurance by age bracket. The maps below show the uninsured percent of population by state for several age groups. Overall, the population age 65 and over is most likely to have health insurance (99.17% insured), followed by the population under age 19 (94.63% insured) and the population age 35-64 (89.44% insured). The population age 19-34 is the least likely to have health insurance coverage (85.54% insured).
Map: Created with Maptitude Mapping Software by
Caliper, April 2025
Sources: 2023 Census American Community
Survey
#Maptitude #HealthInsuranceCoverage #UninsuredPopulation
Home | Products | Contact | Secure Store
