Included with Maptitude are the Census Place and County Subdivision outlines from the US Census Bureau. The County Subdivisions in the north-east and the Census Place in the midwest and west, are a close representation of the city limits for a specific city. The layer that you use depends on your location and your specific needs. It should be noted that the actual city limits might be slightly different and if it is important, please check directly with the actual city for more detailed information. Follow the steps below to highlight a city area and change the outline or fill color:
- Open a new map in an existing workspace by choosing Map>New Map and creating a map of the city of interest.
- When the map opens, make sure that the Census Place or County Subdivision (this depends on the map location and your own personal needs) layer is turned on in the Display Manager.
- If the Display Manager is not currently visible, then go to the word “Map” at the top and choose “Display Manager Toolbar”
- Make the Census Place or County Subdivision layer the working layer by right-clicking on the layer name and choosing “Make Working Layer”, or by selecting it from the dropdown list at the top of the Display Manager.
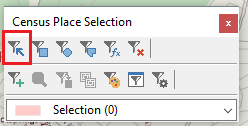
- Use the Selection toolbar, click on the “Select by Pointing” tool.
- If the selection toolbar is not visible, go to the word “Selection” at the top and click on “Toolbar”.
- If there is already a check-mark next to Toolbar, then it is already open. If you are having trouble finding the toolbar then just turn it off and on a few times to see if you can see it when it opens up. It looks like this:
- Now click on the map somewhere inside the city of interest. This will highlight the area of the city. If this does not look like the correct area, then you can clear the selection and try again.
- For more information about using the Selection toolbar, please just click anywhere on the toolbar and click “F1” on your keyboard to pull up the Help topic.
- Once you have selected the area for the city of interest it is added to a “Selection Set”.
- This Selection Set shows up below the Census Place or County Subdivision layer heading in the Display Manager on the left.
- You can expand the options under Census Place or County Subdivision by clicking on the “+” sign to the left of the layer name and the word “Sets”.
- You can right-click on the word “Selection” under the Census Place or County Subdivision layer and choose “Rename” and name it with the City name.
- The fill color used for this city will now be controlled by the display characteristics for that “Selection Set”. You can modify this by clicking on the icon to the left of the Selection Set.
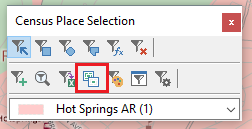
- You can also choose to show only your selected city by using the Selection Toolbar again. Click on the “show one set/ all features” button to do this.
If you want to have a completely separate City Boundary layer for your area of interest, follow these steps:
- After you have selected your area as described above, again make sure Census Place or County Subdivision is the working layer.
- Go to File>Export>Geography and make the following settings:
- Export: Choose the selection set you created above
- To: Standard Geographic file
- Data Field: ID
- Layer Name: {Type the city name here}
- Uncheck the box for “Include built-in data”
- Check the box for “Add layer to map”
- Uncheck the box for “Export as Centroid Points”