How do I make map themes look good?
A discussion of best practices for making thematic maps look good and convey data clearly using GIS software
Maptitude Learning Portal articles tagged with Chart
A discussion of best practices for making thematic maps look good and convey data clearly using GIS software
How to customize your Maptitude Chart by adding a regression line for a Scatter Plot
How to customize the order of the fields in a chart theme
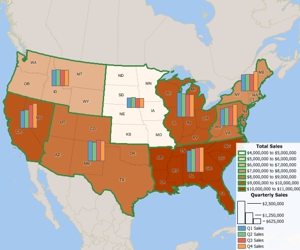
Using the MapWizard® tools to create color/heat themes, chart themes, dot-density themes, 3D themes, and scaled-symbol size themes, pattern and multiple symbol themes, and bubble theme maps.