

Authors:
Brett Lucas
and Stewart Berry
This article explores how to use one of Maptitude’s latest add-ins for "Land Use Mix." Land use mix calculations are useful to local municipalities in quantifying access to services. The tool looks at a specific land use category and compares that to other types within the same geography. This entropy measure quantifies the balance of types using a score of 0 to 1 to describe equitable access. The primary application of the tool is for zoning or with Comprehensive Plan land use maps. Typically, a zoning layer is measured using a GIS (Geographic Information System) and we use Maptitude Mapping Software in this analysis.
Descriptions of the characteristics of the built environment assist in determining accessibility, and aid in assessment of urban form. Determining the relationship of urban form with levels of accessibility requires measures that allow contrasts in urban environments to be described. Features such as pedestrian-oriented design, high levels of public transport, and the proximity to destinations (such as services and jobs) could reasonably be expected to influence the mode of transportation. Such measures can also assist in healthcare geoaccess reports.
The Land Use Mix or Entropy measure is widely used in determining the accessibility balance. A simplifying assumption here is that a community has distinct land use zones (i.e., low density residential, high density residential, commercial, industrial, etc.).
We will be looking at the City of Spokane Valley, Washington as an example in this case study. Spokane Valley is a community of 103,000 people, located just east of the City of Spokane. The City of Spokane Valley incorporated on March 31, 2003. The city was formed from combining the urbanized unincorporated areas east of Spokane, including the census-designated places (CDPs) of Dishman, Opportunity, Trentwood, Veradale, and portions of Greenacres, and East Spokane.
This research looks at some of the Comprehensive Plan Land Use Designations (i.e., Industrial, Commercial-mixed Use, and Parks/Recreation/Open Space) to determine how accessible these land use designations are in relation to the Single-Family Residential Designation. To assess "accessibility," we are using the Census Block Group Layer (from Maptitude). For a community of this size, Block Groups offer a level of granularity that is appropriate for the scale of the analyses as compared to the Tract or Block Level. Depending on your community and the analysis you are doing, the Block Group level may or may not be appropriate. While this scenario is using the Comprehensive Plan Land Use Designations (more generalized in detail), this approach may be used with Zoning Districts which tend to be smaller in size and more detailed.
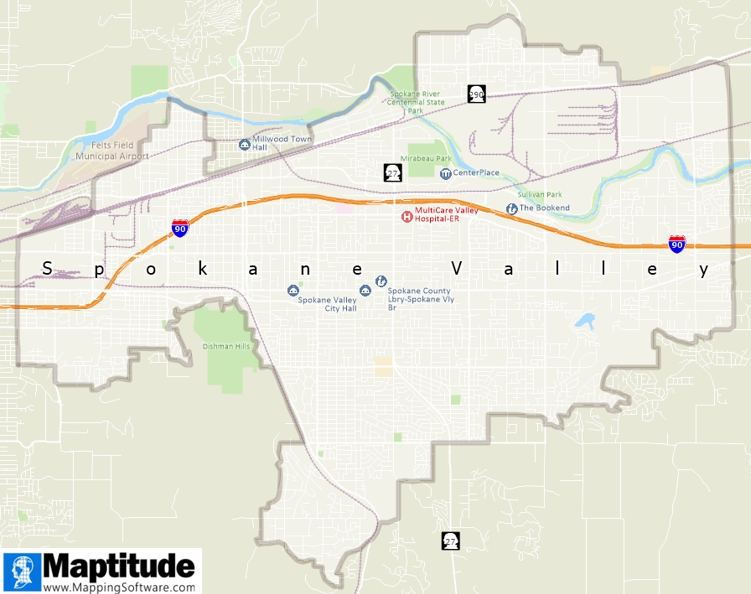
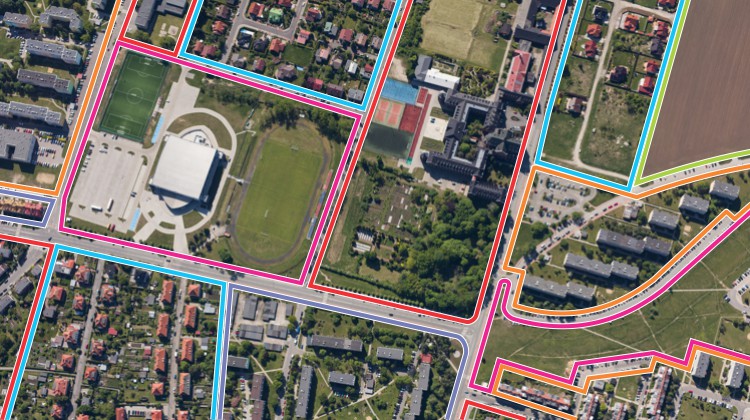
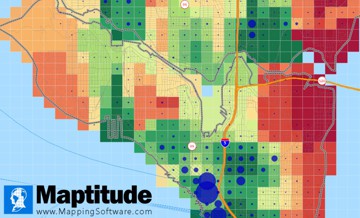
Map 1 – Maptitude Workspace – Study Area (Spokane Valley, WA)
In this case, we gathered Comprehensive Plan designation data from the City of Spokane Valley’s GIS Department. We had the option of a shapefile or an ESRI geodatabase, both of which can be used with Maptitude.
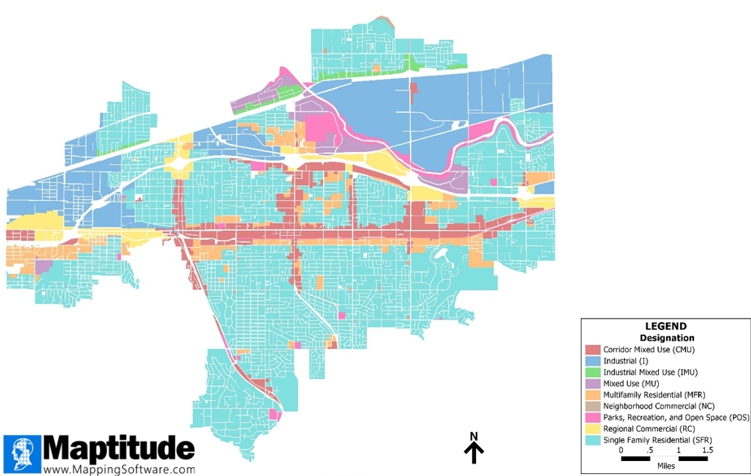
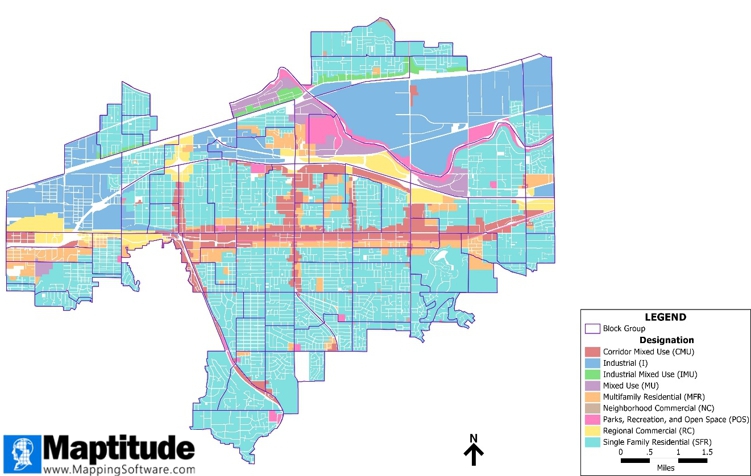
Map 2 – Maptitude Workspace – Spokane Valley – Land Use Designations Mix
After bringing in the Comprehensive Plan Land Use Designations layer, the next step is to restrict ("clip") your analysis geography layer to the same geography as your land use. In this example, we clipped the Census Block Group Layer.
Next, make the "clipped" Census Block Group layer the working layer.
Next, click on "Tools" tab, scroll down to "add-ins" and select Land Use Mix, if you have already installed the add-in on your computer. If you do not have the tool, go to the Maptitude website to download the tool for free if you are running Maptitude 2022 or newer.
Before running the "Land Use Mix" tool, your screen should look something like this (Map 3) with your land use and analysis layers.

Map 3 – Maptitude Workspace – Land Use Designations Mix and Census Block Groups
Once you click on the "Compute Entropy Index" add-in tool, you will see the following dialogue box.
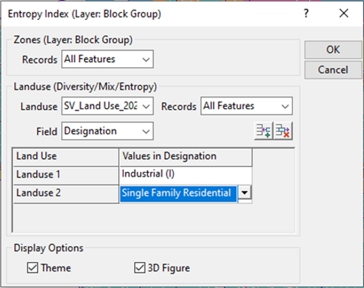
Figure 1 – Land Use Mix Dialogue Box - Industrial vs. Single-Family Residential
Dialog Box
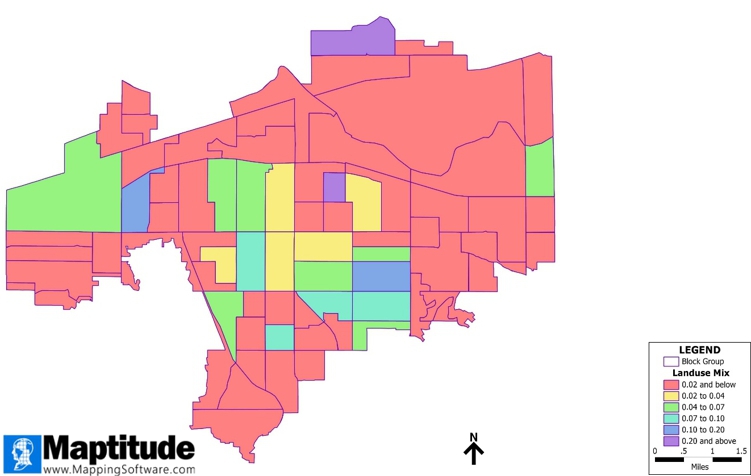
By default, the output map will use a light red to dark red color ramp to show the level of entropy. We changed the output color theme to a red to purple color ramp and reduced the optimal breaks from ten to six. Entropy measures accessibility on a scale of 0 to 1, with 0 having virtually no accessibility and 1 having relatively full accessibility. In this example, most areas of Single-Family Residential next to other areas of Single-Family Residential will have low accessibility to Industrial and will have a low score (i.e., 0.20), and by proxy lower access than other areas to industrial employment. Single-Family Residential areas that are closer to Industrial or abut up against an Industrial land use designation will have a higher score. In this example, Single-Family Residential zones located on the northside of Spokane Valley are closer geographically to Industrially designated land uses, and therefore will have an entropy score between 0.30 and 0.90.
Map 4 – Maptitude Workspace – "Land Use Mix" – Industrial vs. Single-family Residential - Output map showing measures of entropy on the Census Block Group layer
Map 5 – Maptitude Workspace – "Land Use Designations Mix" to compare against the Entropy output
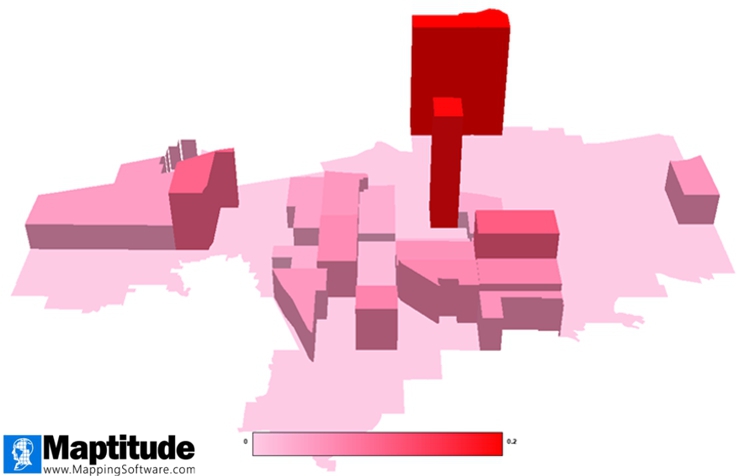
Alternatively, the thematic output map can also be shown as a chart, showing the same information in a 3D perspective. Depending on your audience, this output could be useful and can help identify outliers not apparent in a 2D map.
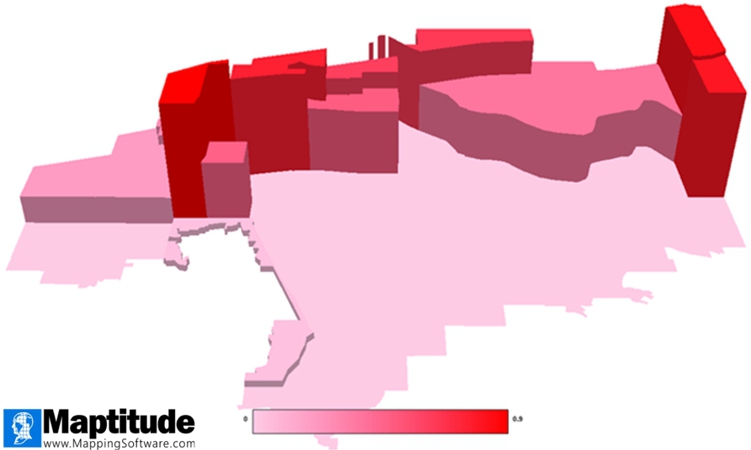
Map 6 – Maptitude Workspace – "3D Figure" showing measures of entropy on the Census Block Group layer
Next, we will run the "Land Use Mix" tool for other land use interactions. Again, make the "Block Groups" your working layer. For the Neighborhood Commercial verses Single-Family Residential analysis, your dialogue box will look like this:
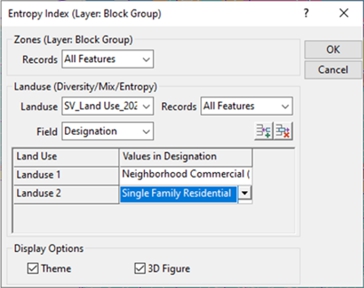
Figure 2 – Land Use Mix Dialogue Box - Neighborhood Commercial vs. Single-Family Residential
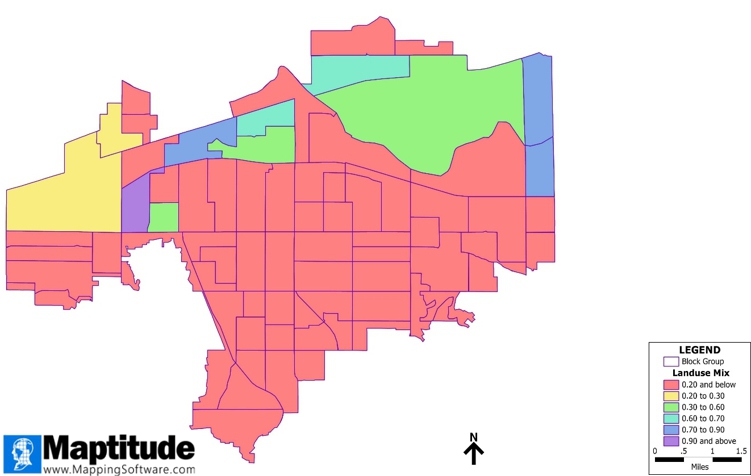
The output map for this land use interaction shows a higher entropy for the Single-Family Residential designations located near the center of Spokane Valley, which is where some of the Neighborhood Commercial land use designations are located along the Sprague Avenue corridor, and so have better access to shopping for example.
Map 7 – Maptitude Workspace – "Land Use Mix" – Neighborhood Commercial vs. Single-Family Residential - Output map showing measures of entropy on the Census Block Group layer
Map 8 – Maptitude Workspace – "3D Figure" showing measures of entropy on the Census Block Group layer
Finally, we will run the "Land Use Mix" tool for Parks/Recreation/Open Space layer verses the Single-Family Residential analysis. Your dialogue box will look like this.

Figure 3 – Land Use Mix Dialogue Box - Parks/Recreation/Open Space vs. Single-Family Residential
The output map for this land use interaction shows a higher entropy for the Single-Family Residential designations located near Parks and Open Space. Since parks and open space are scattered throughout the community, the entropy output is the most diverse showing that many Single-Family Residential land use designations have access to parks and open space, except those that are located near the I-90 corridor.
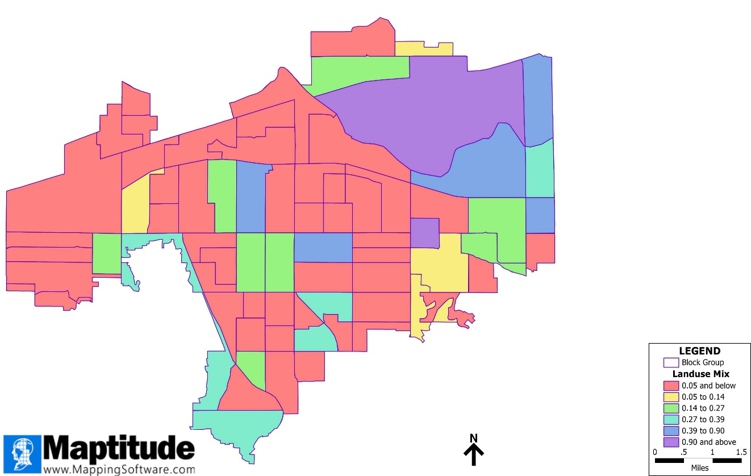
Map 9 – Maptitude Workspace – "Land Use Mix" – Parks/Recreation/Open Space vs. Single-Family Residential - Output map showing measures of entropy on the Census Block Group layer
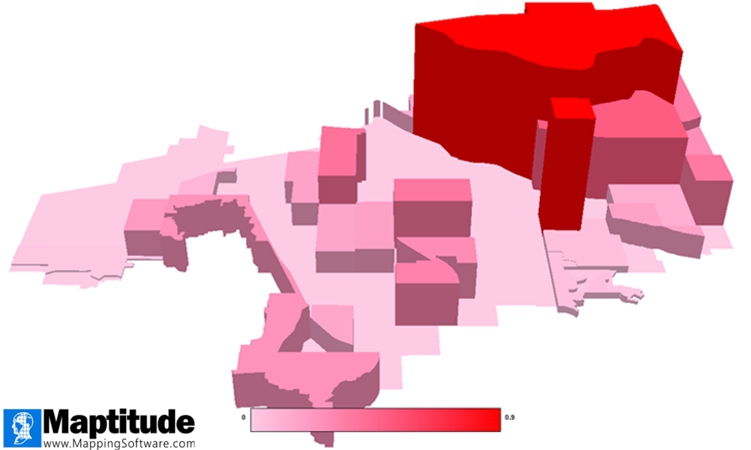
Map 10 – Maptitude Workspace – "3D Figure" showing measures of entropy on the Census Block Group layer
Land Use Mix/Entropy is an extremely useful tool for analyzing and measuring accessibility and for exploring changes based on various underlying assumptions. For example, let’s say you have three vacant pieces of land in your community, and you wanted to see which one, if developed, as a park would provide the most accessibility to nearby residential housing. This provides an analytical tool to prioritize which site to potentially develop.
To take the Land Use Mix/Entropy analysis to the next level, one could add additional fields that measure levels of attractiveness (i.e., trails, ball fields, play structures, etc.) and run the model based on that to better refine your analysis on the best site.
Have fun exploring other Land Use Mixes with this add-in tool in Maptitude!
Learn more about Maptitude to see how you and your team can make informative and insightful maps!
Schedule a Free Personalized Demo

Home | Products | Contact | Secure Store
