Mapping software such as Maptitude includes the tools you need to create map visualizations of the geographic elements in your data. In only a few clicks you can create heat maps, pin maps, 3-D prism maps, maps with charts, and sized pin maps, enabling you to discover the patterns hidden in your data.
Data visualization tools in Maptitude business map visualization software can show geographic patterns in your data
 |
“Overall, this product makes it incredibly simple to visualize and map both customer & company specific data. It is very intuitive and easy to pickup from the get go.”
|
A map visualization is a graphical representation of information. The original data is often stored in a spreadsheet such as Excel or a database such as SQL Server. A mapping application is used to read the table from the original tables and to display it in an informative and appealing way. A map is a perfect medium for analyzing business data, due to the intuitive nature of geographical information.
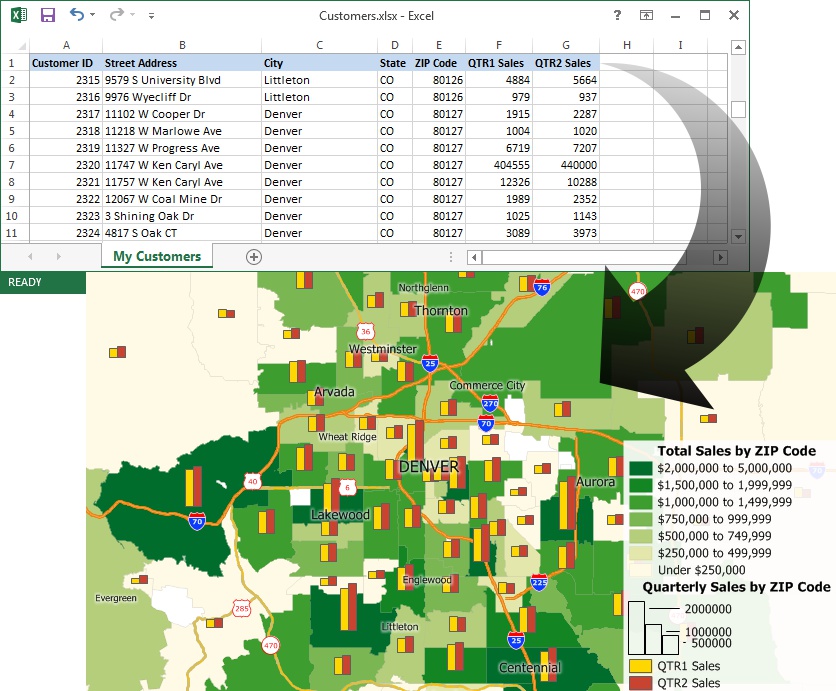
A map visualization of business data stored in an Excel spreadsheet
Map visualizations have many benefits, the most important of which is that they convey complex, dry, and flat, spreadsheet data in a much more appealing format. Maps allows exploration and discussion of data in ways that a database does not permit. This allows analysts to gain insights into their business processes that they would otherwise miss. Being able to visualize the territories for a company’s sales representatives, where customers are located, or where deliveries are scheduled to be made, supports better decision making.
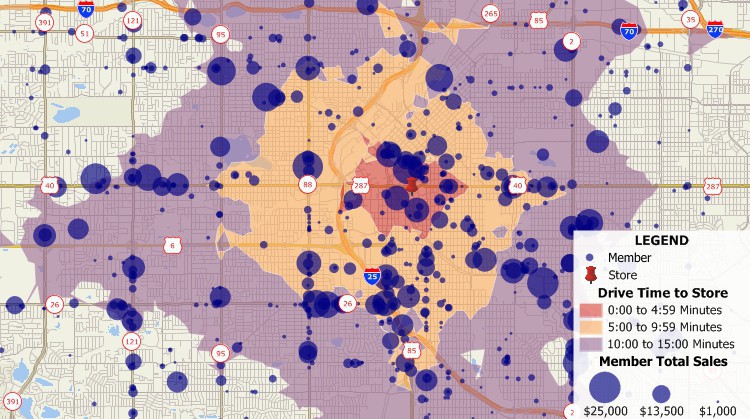
Visualize customer and store data relationships with Maptitude
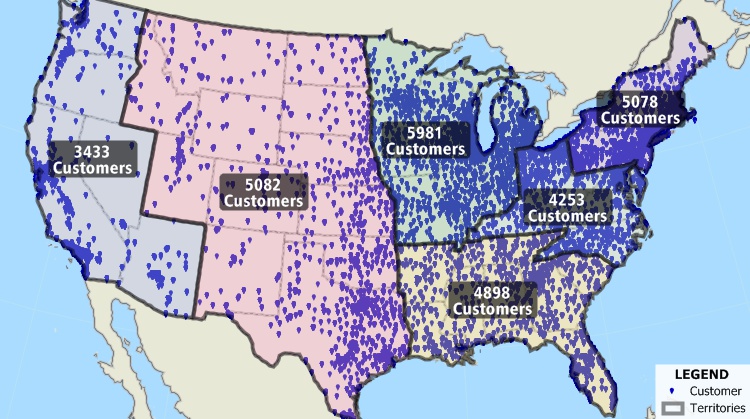
Locate unlimited business records with Maptitude business data visualization software
The old, old, school way to create a map visualization was on paper and by hand. But even today, many software applications rely on the user to source and construct a map with the necessary background information, before they can even begin to start analyzing their own spreadsheets. Innovative map visualization software such as Maptitude provide all the information analysts needs to conduct meaningful business analysis. The maps provided are presentation-ready and guide the user through the process of locating the organization’s assets on a map.
There are a few recommended ways to perform business map visualization:
The biggest mistake would be assuming that all map visualization tools are the same. Many applications use credits and charge for every action you take with the application. In addition, such applications don’t supply all the information you need to begin to explore your business challenges.
Popular mapping software such as Maptitude are designed to minimize your costs, including your precious time. A Wizard-driven and intuitive interface ensures that you get the most our of your investment, while having no hidden charges. Companies often have large volumes of big data and Maptitude can handle unlimited numbers of records, with no additional costs to pushpin them all on a map or to perform analytics on the locations
These are some of the best map visualizations:


Check out these other types of map visualization
The demand for data analysis and the research analysts to perform this work is skyrocketing. This is because optimizing your operations is critical in order to stay competitive in a global marketplace. The benefits of spatial data visualization are that it is a critical tool that facilitates discussion between teams, emphasizes aspects of the issues that you wouldn’t otherwise see, and is an attractive and intuitive medium for exploring big data and complex information. Organizations are rushing to implement map data visualization technology, and Maptitude is the perfect interactive map visualization tool to ensure a smooth transition for your analysts.
Check out these other pages and posts to learn more about map visualization:
Request a demo or download a trial of Maptitude to see how visualizing business data can benefit your company!
Home | Products | Contact | Secure Store
