If you need a custom map for your story, blog, or website, contact us because we offer a limited number of free custom maps on a first-come, first-served basis! See our Featured Maps for inspiration.
Maptitude is the best mapping software for business intelligence! Maptitude mapping software allows you to incorporate data from numerous sources into your maps.
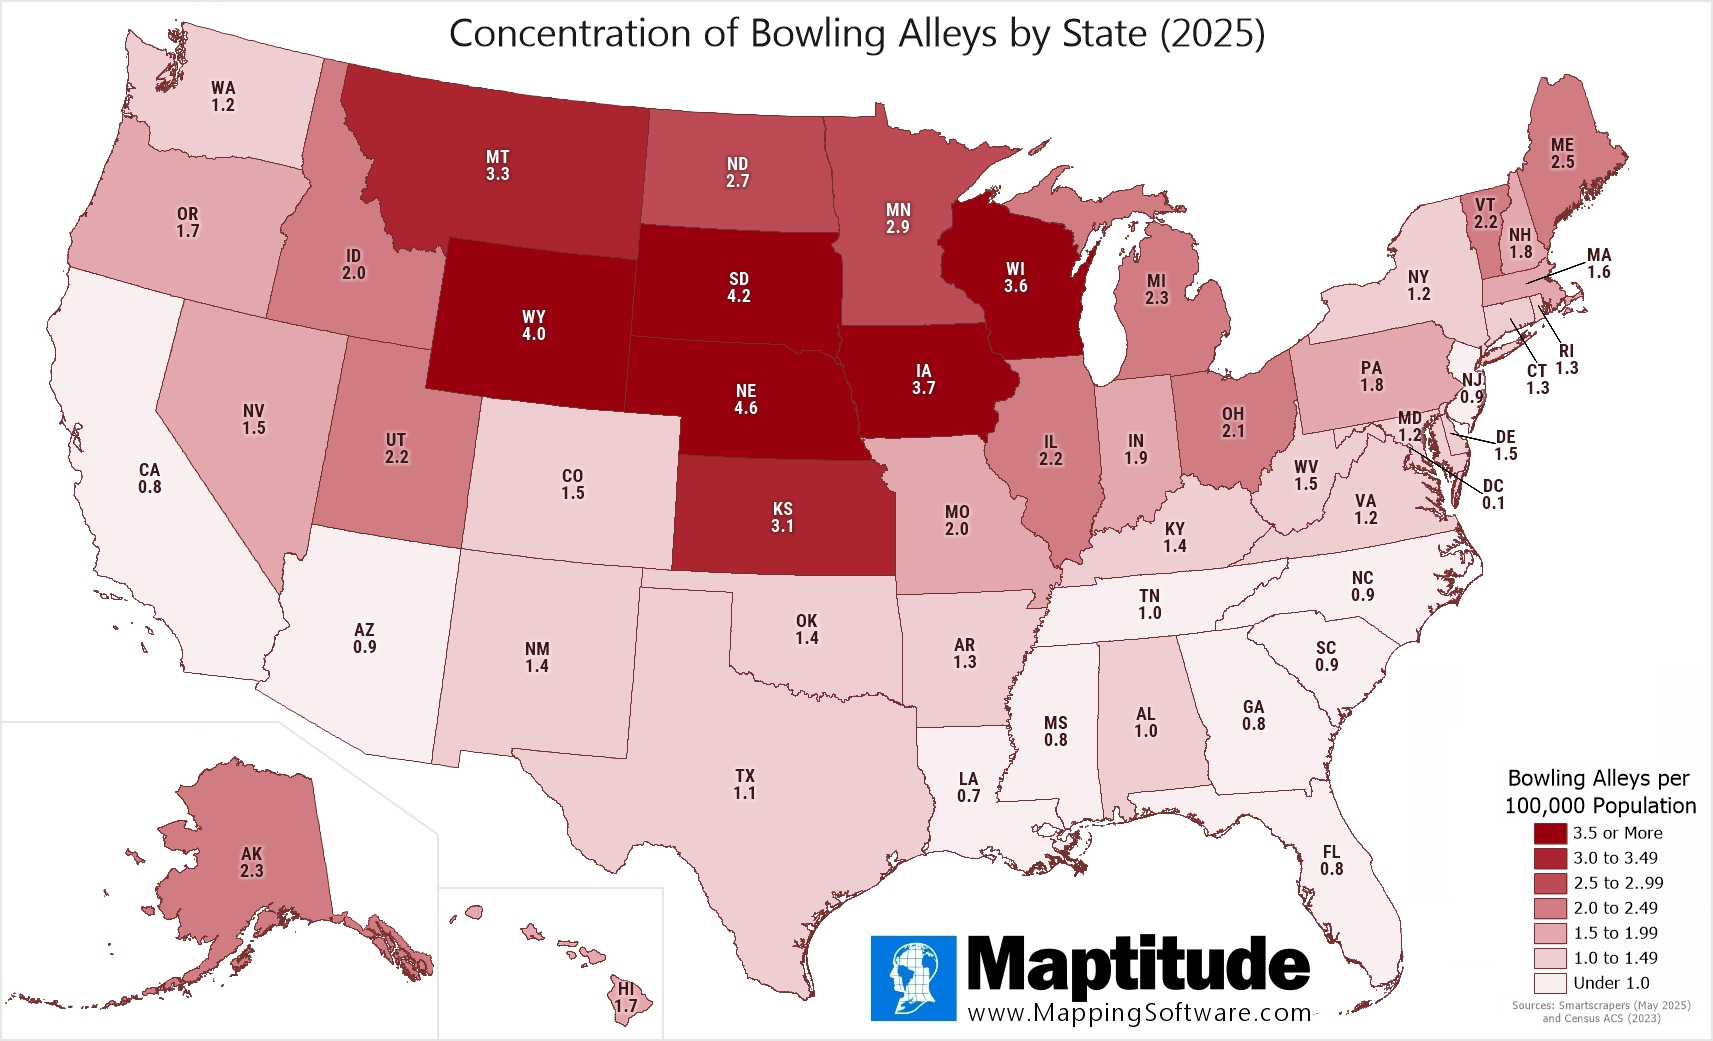
For National Bowling Day (Second Saturday in August) we mapped the concentration of bowling alleys by state. Nationwide, there are 1.4 bowling alleys per 100,000 population. The map shows that the upper Midwest states have the greatest concentration of bowling alleys led by Nebraska (4.6), South Dakota (4.2), and Wyoming (4.0).
Map: Created with Maptitude Mapping Software by
Caliper, August 2025
Sources: Smartscrapers and U.S. Census Bureau
#Maptitude #NationalBowlingDay #BowlingAlleys #BowlingMap
Home | Products | Contact | Secure Store
