If you need a custom map for your story, blog, or website, contact us because we offer a limited number of free custom maps on a first-come, first-served basis! See our Featured Maps for inspiration.
Maptitude is the best mapping software for business intelligence! Maptitude mapping software allows you to incorporate data from numerous sources into your maps.
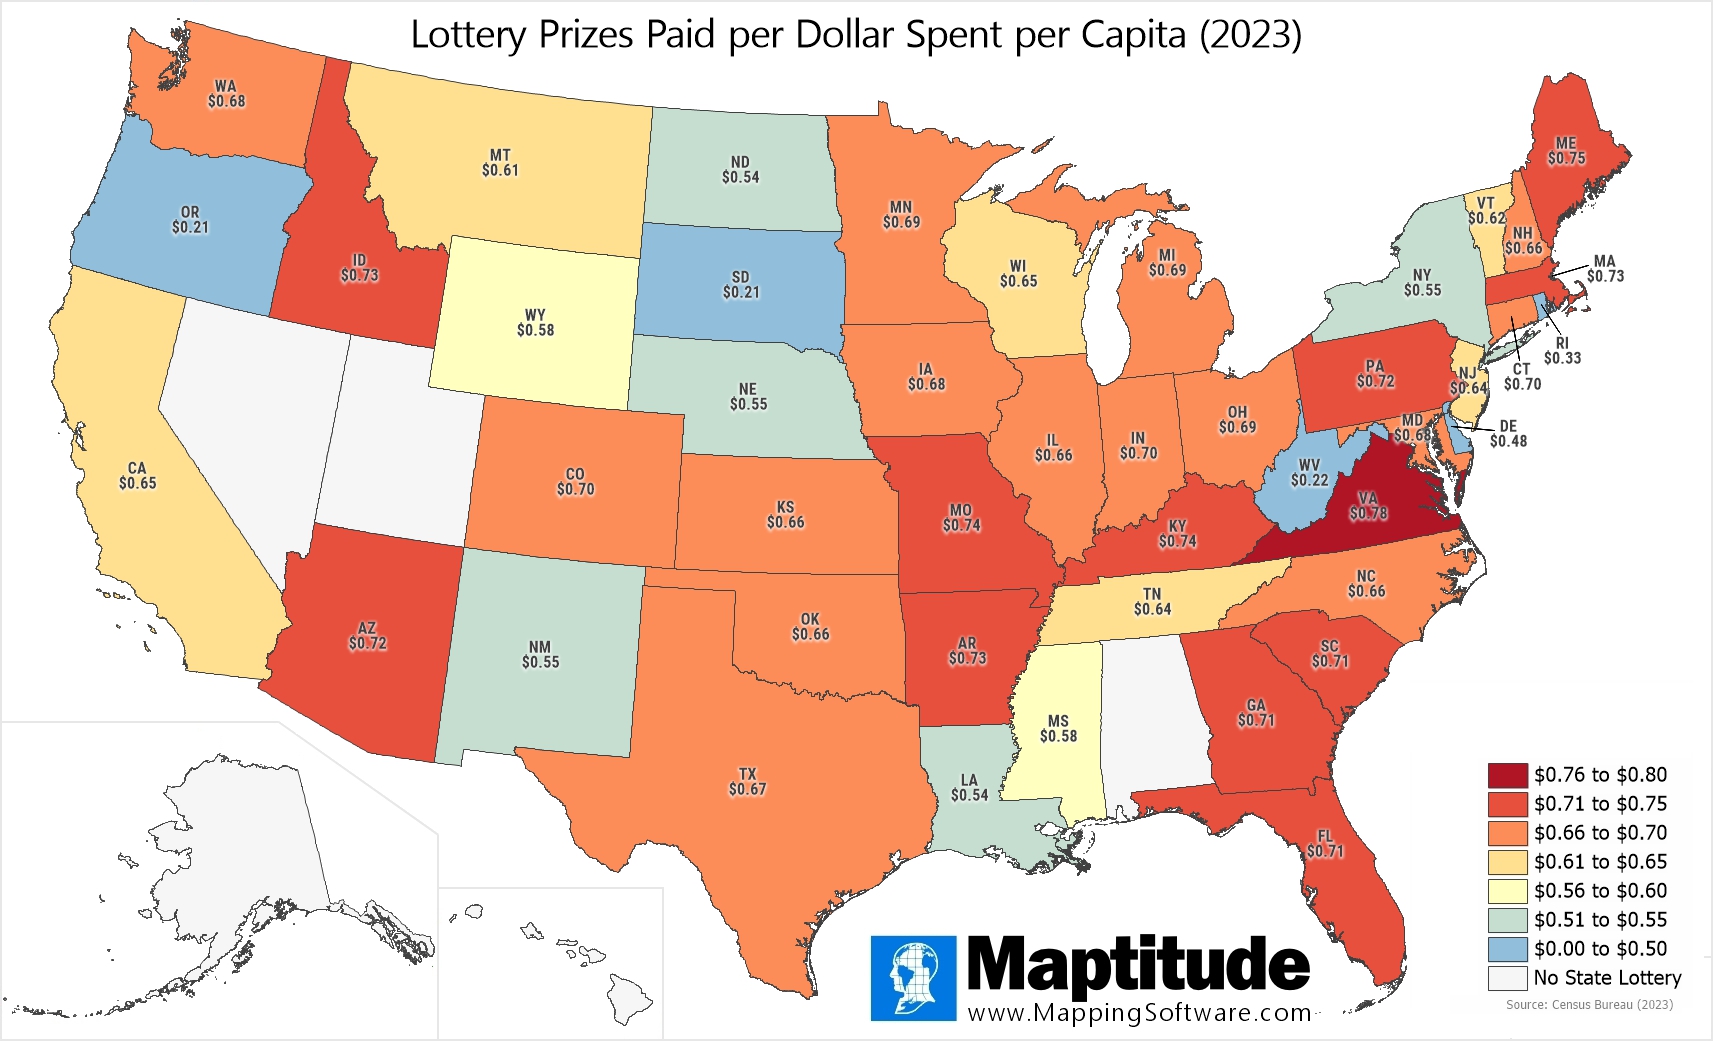
For National Lottery Day (July 17) we mapped the prizes paid per dollar spent per capita by state based on U.S. Census Bureau data. Virginia had the highest prize return ($0.78/dollar spent), followed by Maine ($0.75), and Kentucky and Missouri ($0.74).
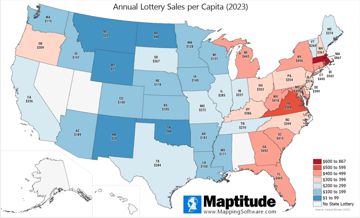
Conversely, four states return less than one-third of a dollar spent back in prizes: South Dakota and Oregon ($0.21), West Virginia ($0.22), and Rhode Island ($0.33). Despite these lower returns, Rhode Island, West Virginia, and Oregon still have rather high lottery sales per capita.
Map: Created with Maptitude Mapping Software by
Caliper, July 2025
Sources: U.S. Census Bureau
#Maptitude #NationalLotteryDay #LotteryPrizes #LotteryMap #July17
Home | Products | Contact | Secure Store
