If you need a custom map for your story, blog, or website, contact us because we offer a limited number of free custom maps on a first-come, first-served basis! See our Featured Maps for inspiration.
Maptitude is the best mapping software for business intelligence! Maptitude mapping software allows you to incorporate data from numerous sources into your maps.
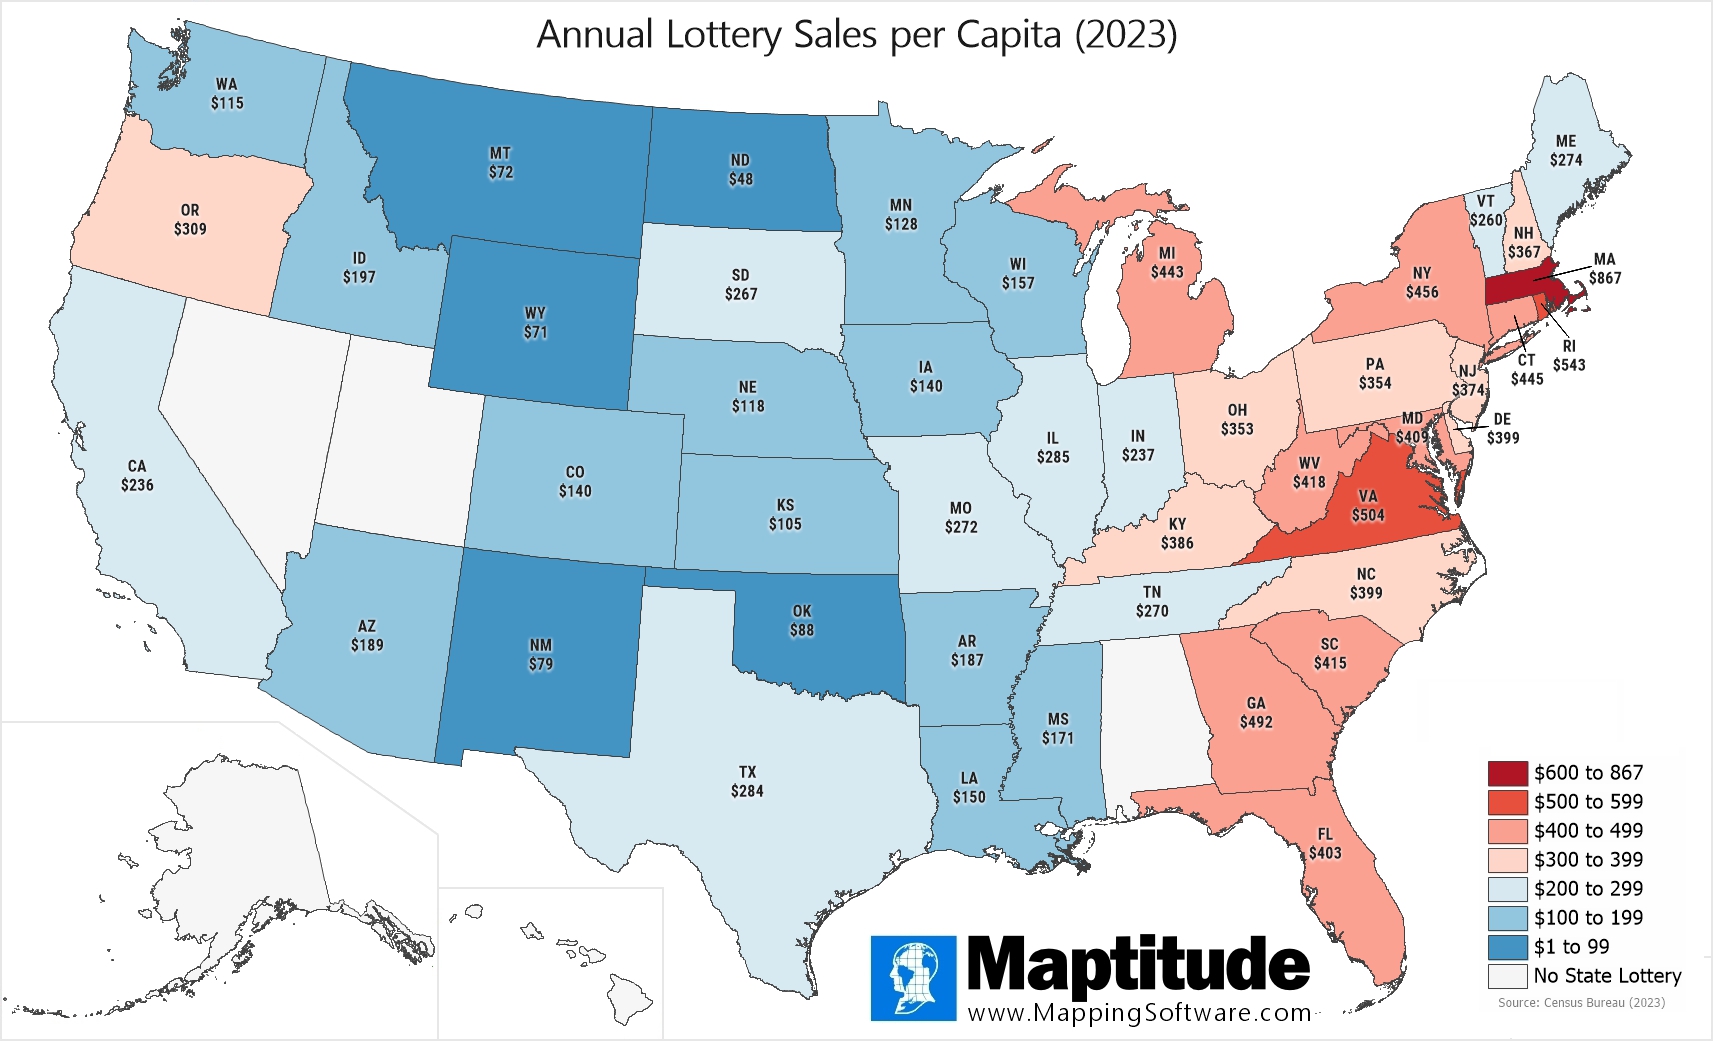
For National Lottery Day (July 17) we mapped per capita lottery sales data by state based on U.S. Census Bureau data. In 2023, an average of $321 per capita was spent on lottery games among those living in states that offer a lottery. The map clearly shows an East Coast bias toward lottery spending with not a single state west of the Mississippi exceeding that average.
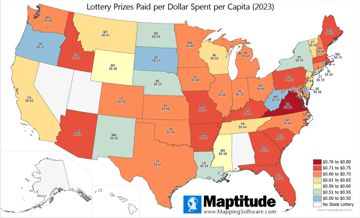
Of states that have a lottery, Massachusetts ($867) has by far the highest per capita spending, followed by Rhode Island ($543), and Virginia ($504). The lowest spending is in North Dakota ($48), Wyoming ($71), and Montana ($72). One explanation of the high level of spending in Massachusetts may be its ability to draw residents from nearby states with lower prize payouts.
Map: Created with Maptitude Mapping Software by
Caliper, July 2025
Sources: U.S. Census Bureau
#Maptitude #NationalLotteryDay #LotterySpending #LotteryMap #July17
Home | Products | Contact | Secure Store
