If you need a custom map for your story, blog, or website, contact us because we offer a limited number of free custom maps on a first-come, first-served basis! See our Featured Maps for inspiration.
Maptitude is the best mapping software for business intelligence! Maptitude mapping software allows you to incorporate data from numerous sources into your maps.
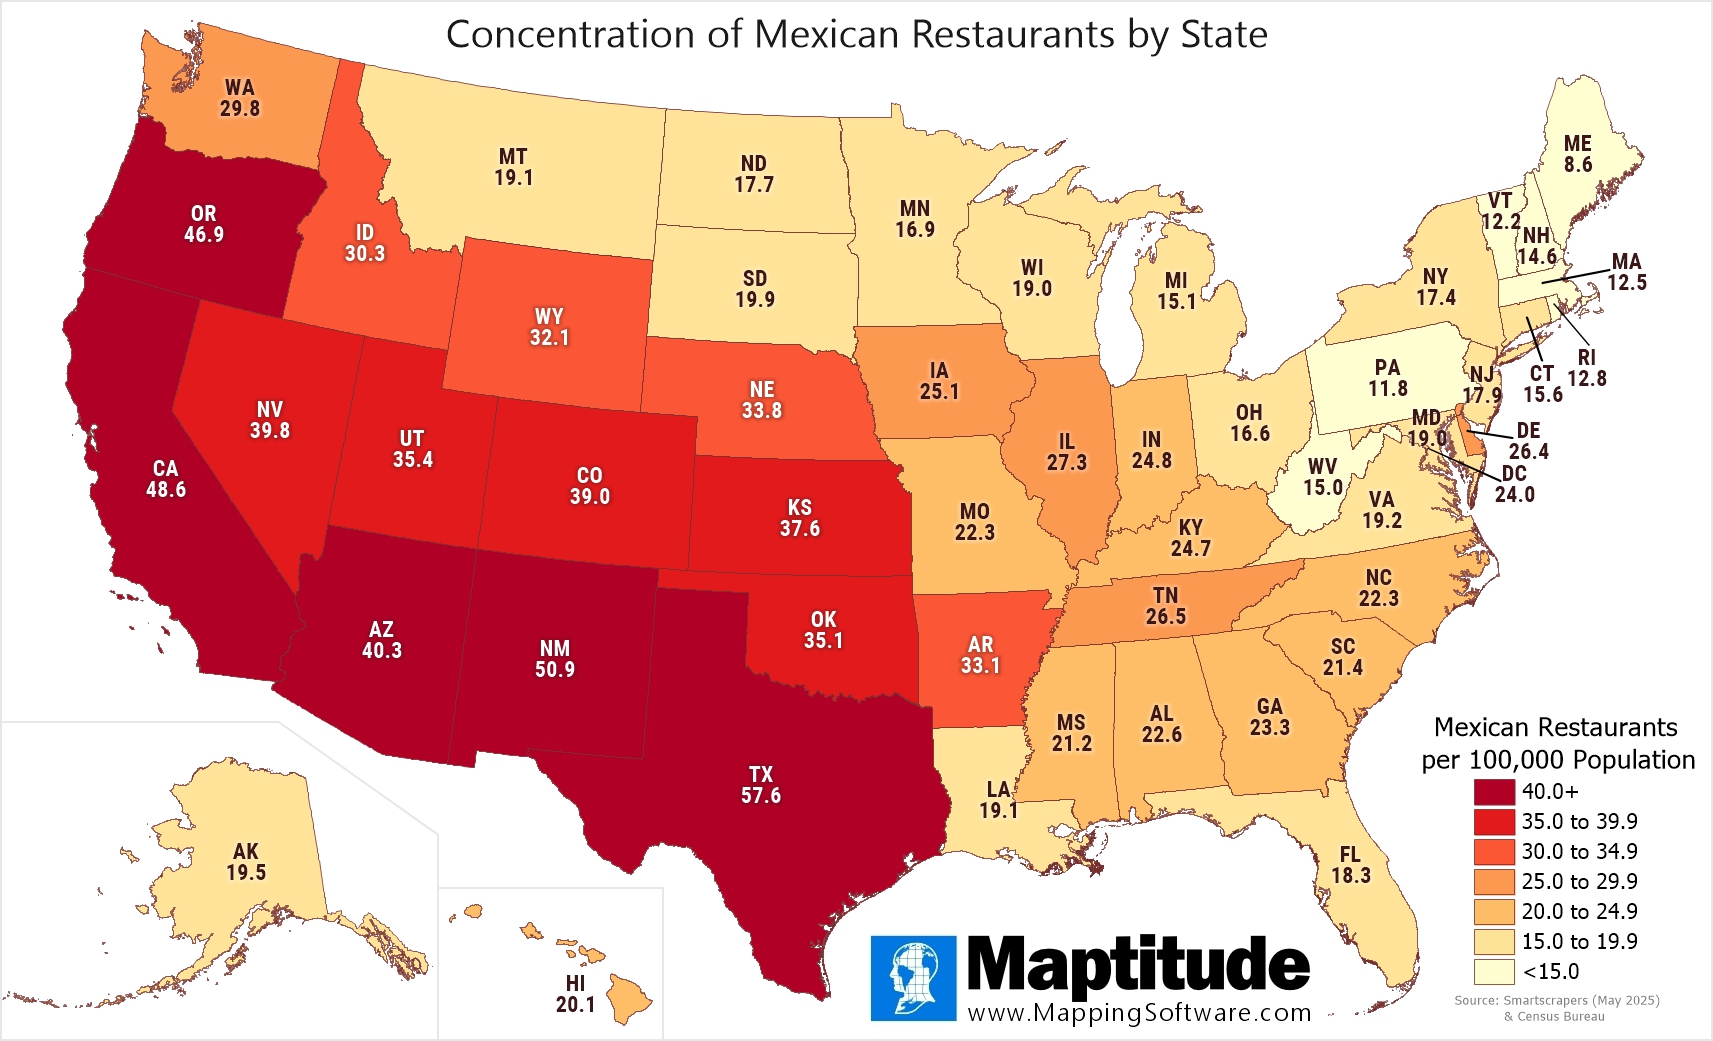
For National Quesadilla Day (September 25) we mapped the concentration of Mexican restaurants by state. Nationwide, there are 28.5 Mexican restaurants per 100,000 population with the highest concentration being in states close to the Mexican border. Texas has more than twice the national average (57.6/100,000), followed by New Mexico (50.9), California (48.6), and Oregon (46.9).
Map: Created with Maptitude Mapping Software by
Caliper, September 2025
Sources: Smartscrapers and U.S. Census Bureau
#Maptitude #NationalQuesadillaDay #MexicanRestaurants
Home | Products | Contact | Secure Store
