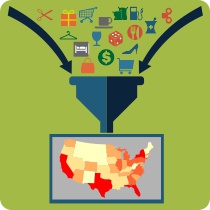
The Business Count Data contains counts of different business types tabulated at the ZIP Code level. These counts can be summed to other layers so that you can create thematic maps at the county or state level.
A common use of the data involves making a color theme based on the number of businesses of some type within a given area. In this example, we will outline how to aggregate the free ZIP Code business count data to the state layer and then create a color theme of the number of logging businesses per state.
- Open or create a map that contains both the ZIP Code Business Count layer and the area layer (e.g., State) to which you want to aggregate the business data.
- Open a dataview of the layer to which you want to aggregate the data (e.g., State) by right-clicking on the layer in the Display Manager and choosing New Dataview.
- Choose Dataview>Table>Modify to open the Modify Table dialog box.
- Click Add Field, type a name for the field in the Field Name column (e.g., Logging Businesses), choose Integer (4 bytes) in the Type column, and click OK. Maptitude adds an empty field at the far right of the dataview.
- Right-click on the new field heading and choose Fill.
- Click the Aggregate radio button to display the Aggregate Data dialog box.
- Choose 5-Digit ZIP Business from the Layer drop-down list, choose Total from the Fill with drop-down list, and choose the field you want to total (e.g., Logging Total) from the other drop-down list.
- TIP: To quickly find the field you want to total, type some letters from the field you are looking for after you have opened the second drop-down list (e.g., to find the Logging Total field, type “logg” to filter the list to the ten logging fields).
- Click OK to close the Aggregate Data dialog box and click OK again. Maptitude calculates the total number of the type of establishment you chose for each area and fills the column with the results.
- From the Window menu choose your map to make it the active window and make the layer to which you aggregated the data (e.g., State) the working layer.
- Choose Map>Thematic Mapping>Color to display the Color Theme dialog box.
- Choose the field that you created and filled with the total number of logging businesses (e.g., Logging Businesses) from the bottom of the Field drop-down list.
- TIP: You can also filter the Field drop-down list by typing some characters in the field name that you created in step 4.
- Click OK. Maptitude adds a color theme to the state layer showing the number of businesses in each state.