Last Updated: March 5, 2025
You can map the Housing Price Index with real estate mapping software.
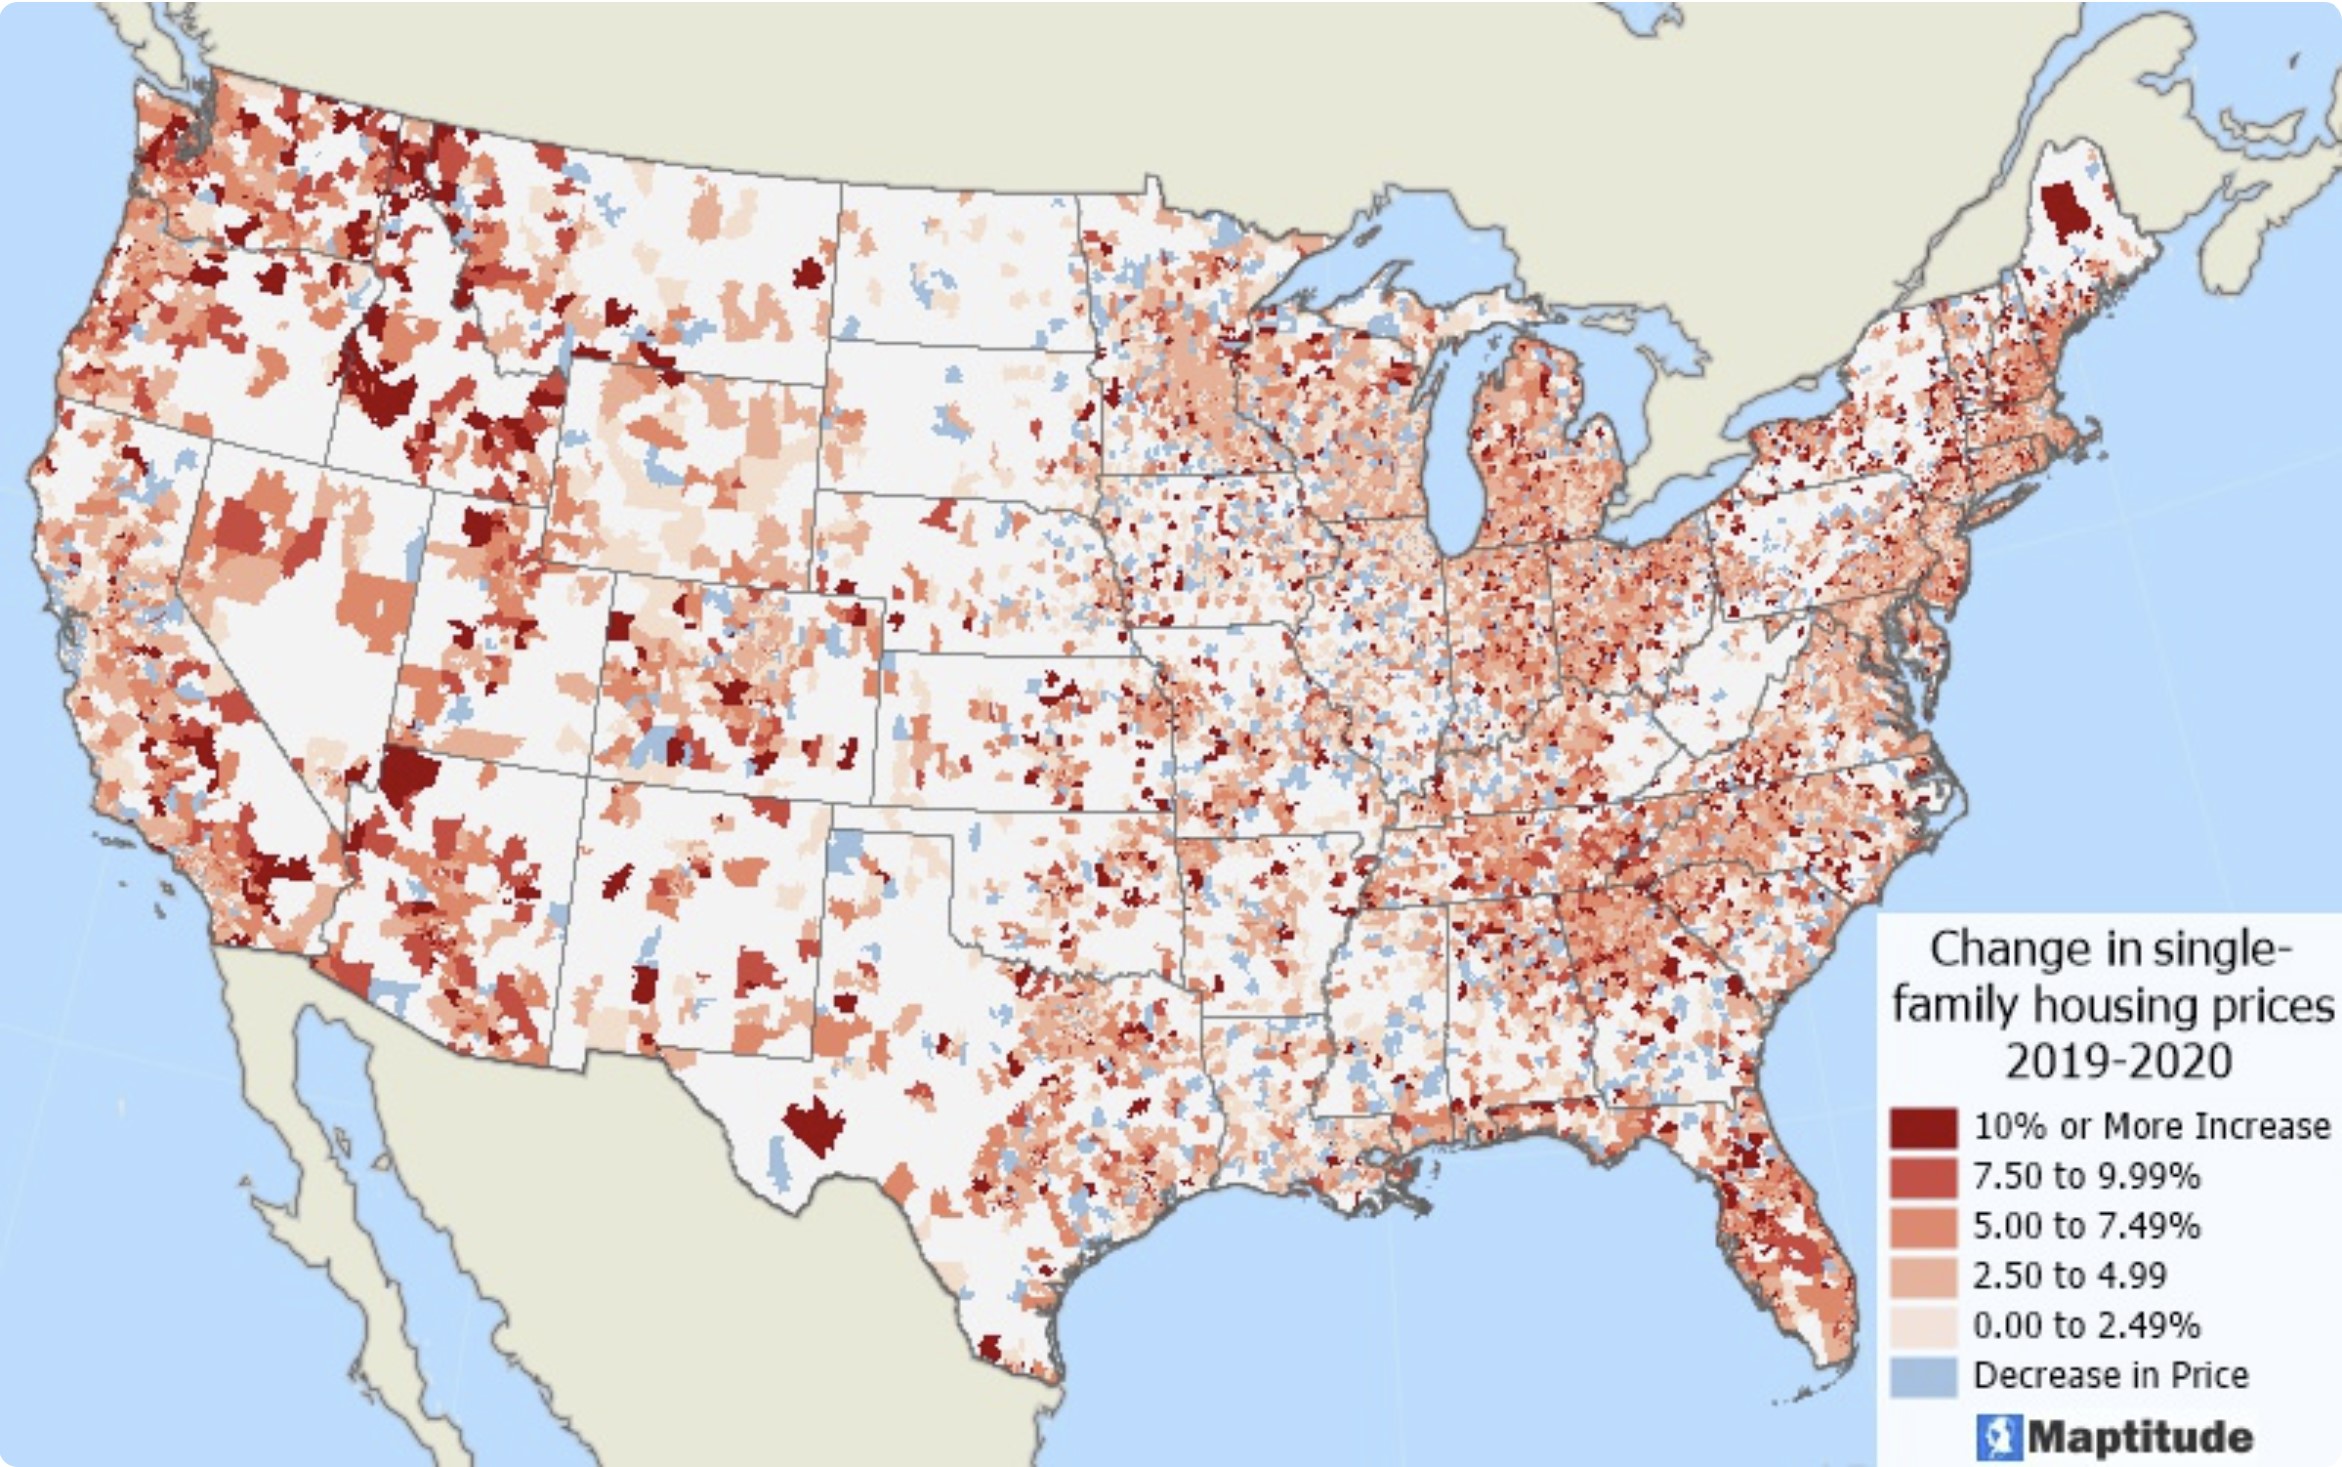
Measuring the percent average change in single-family house prices is possible using the Housing Price Index.
This index tracks refinancing or repeat sales for properties with conventional mortgages held by Fannie Mae or Freddie Mac.
Maptitude can directly consume such data and produce maps that show that even during the 2020 pandemic most ZIP Codes experienced notable increases in house prices.
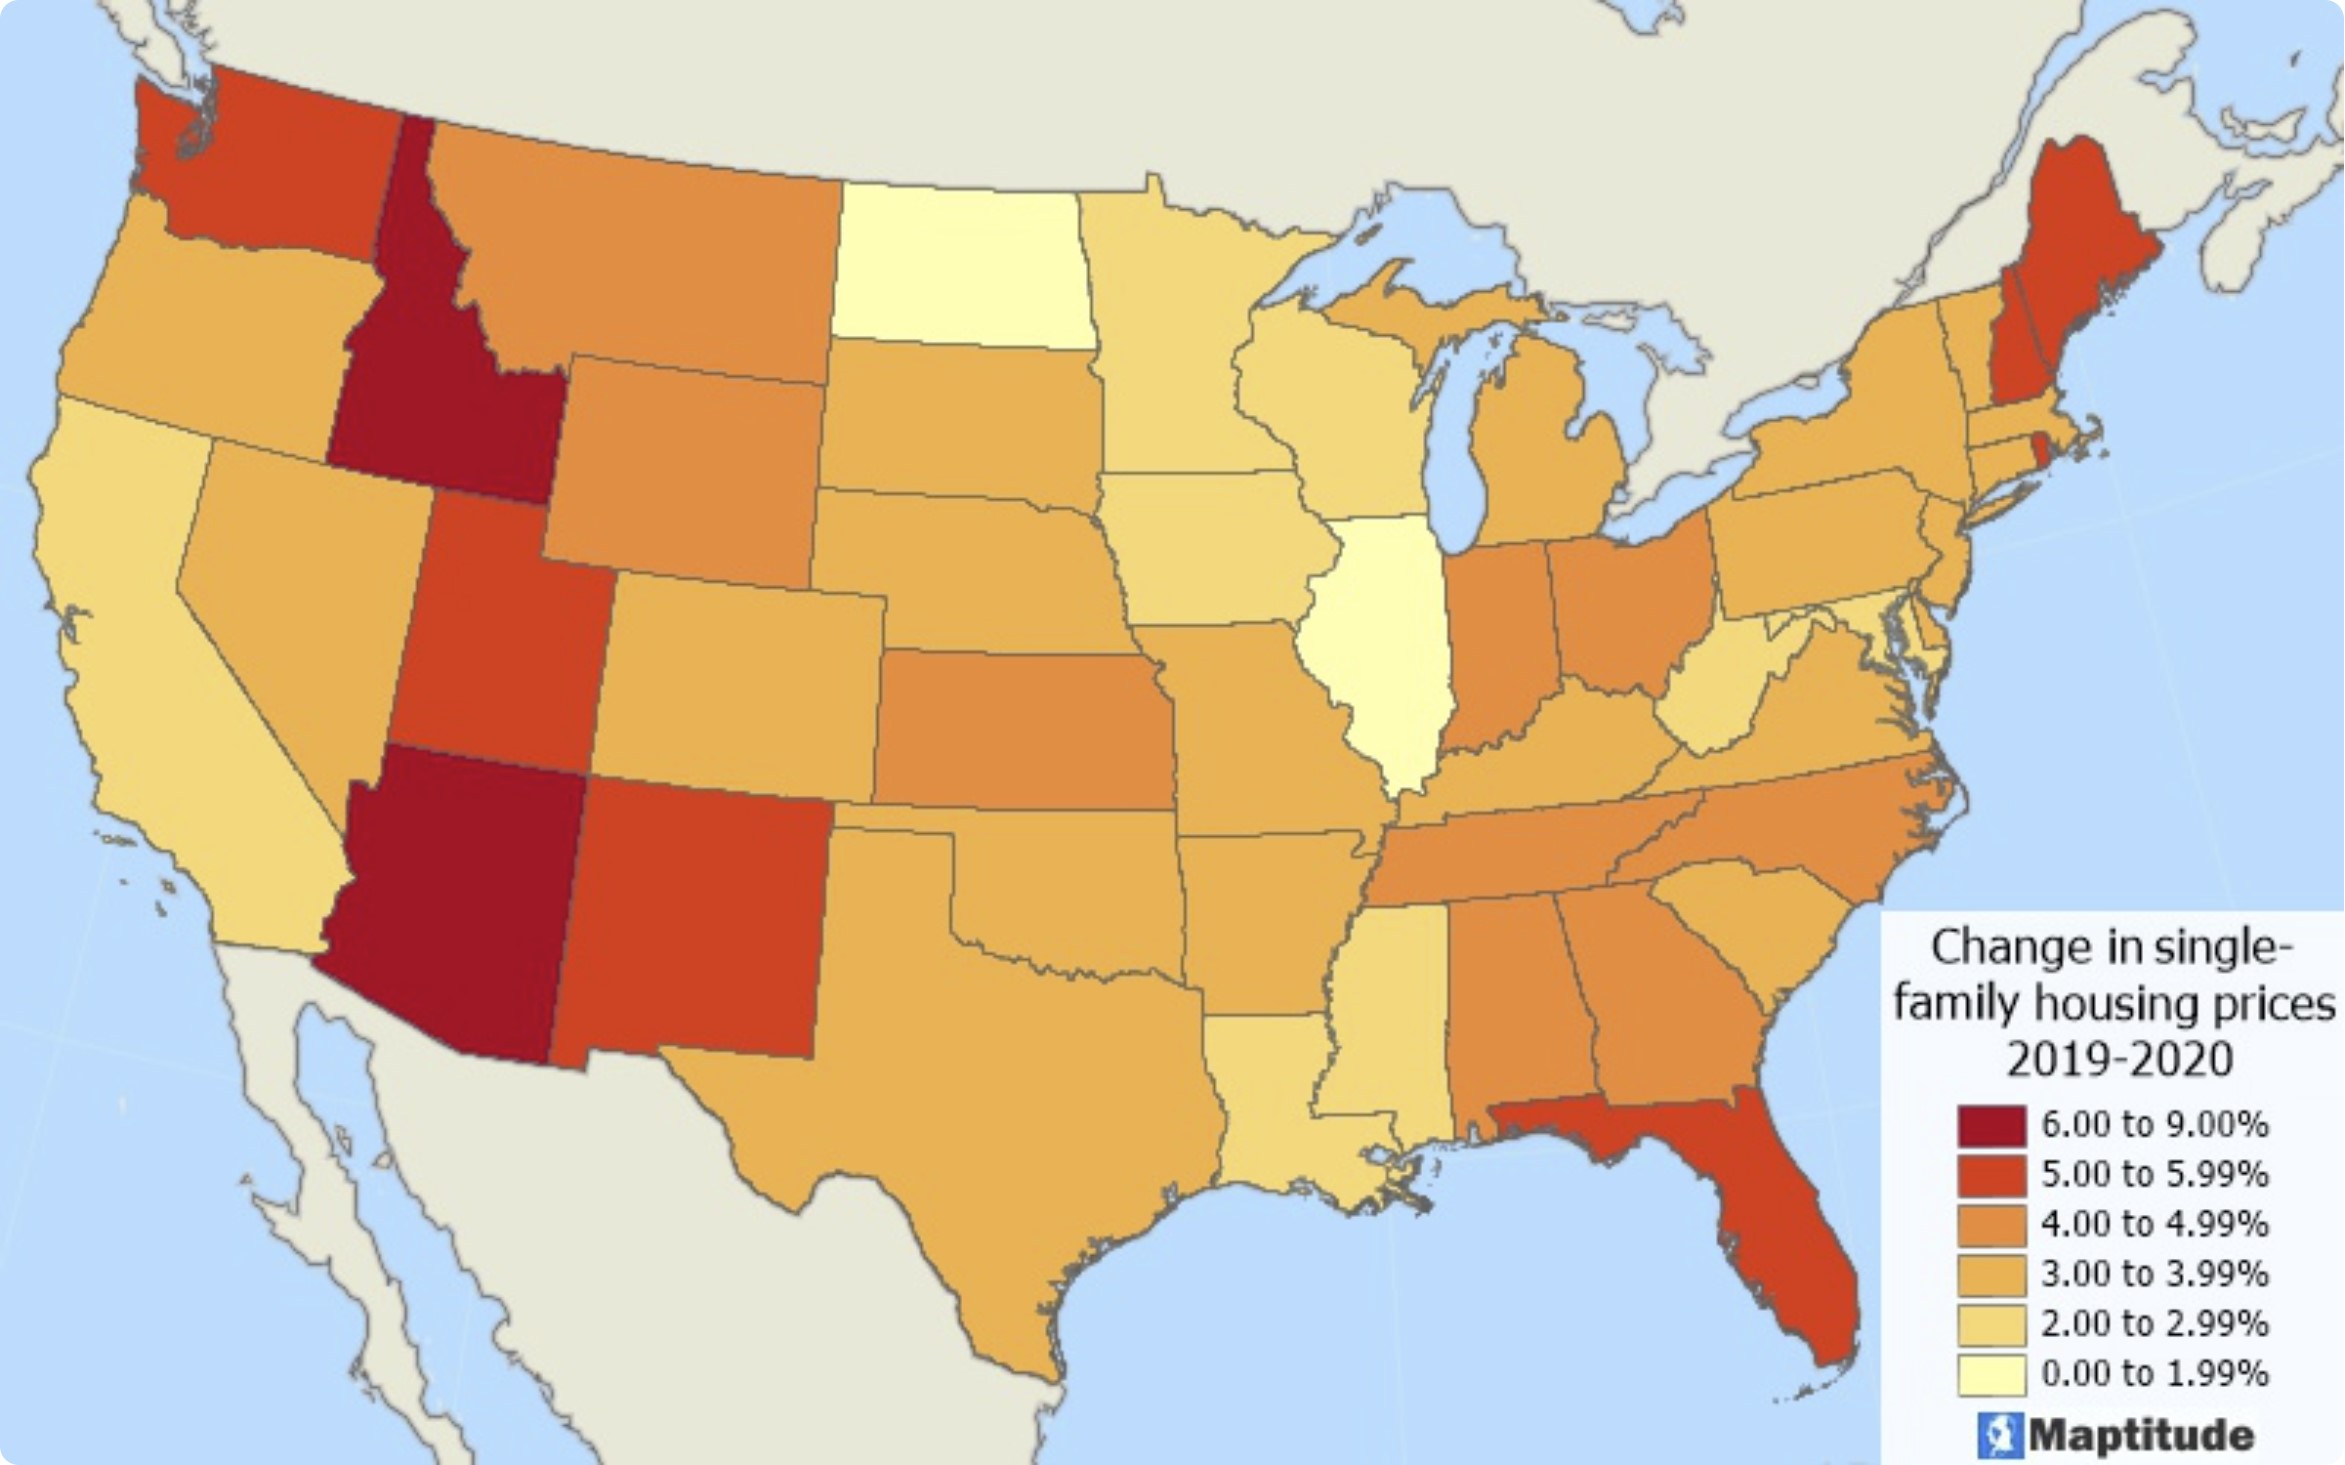
When analyzed nationally, there were no states with negative change in home prices while there were strong increases across the country, especially in the west, northeast, and southeast.
You can map data like this yourself using one or more of the thematic mapping tools in the software.
For how to bring your own data such as this into Maptitude, see the Maptitude tutorial video on creating a map with your own data.