If you need a custom map for your story, blog, or website, contact us because we offer a limited number of free custom maps on a first-come, first-served basis! See our Featured Maps for inspiration.
Maptitude is the best mapping software for business intelligence! Maptitude mapping software allows you to incorporate data from numerous sources into your maps.
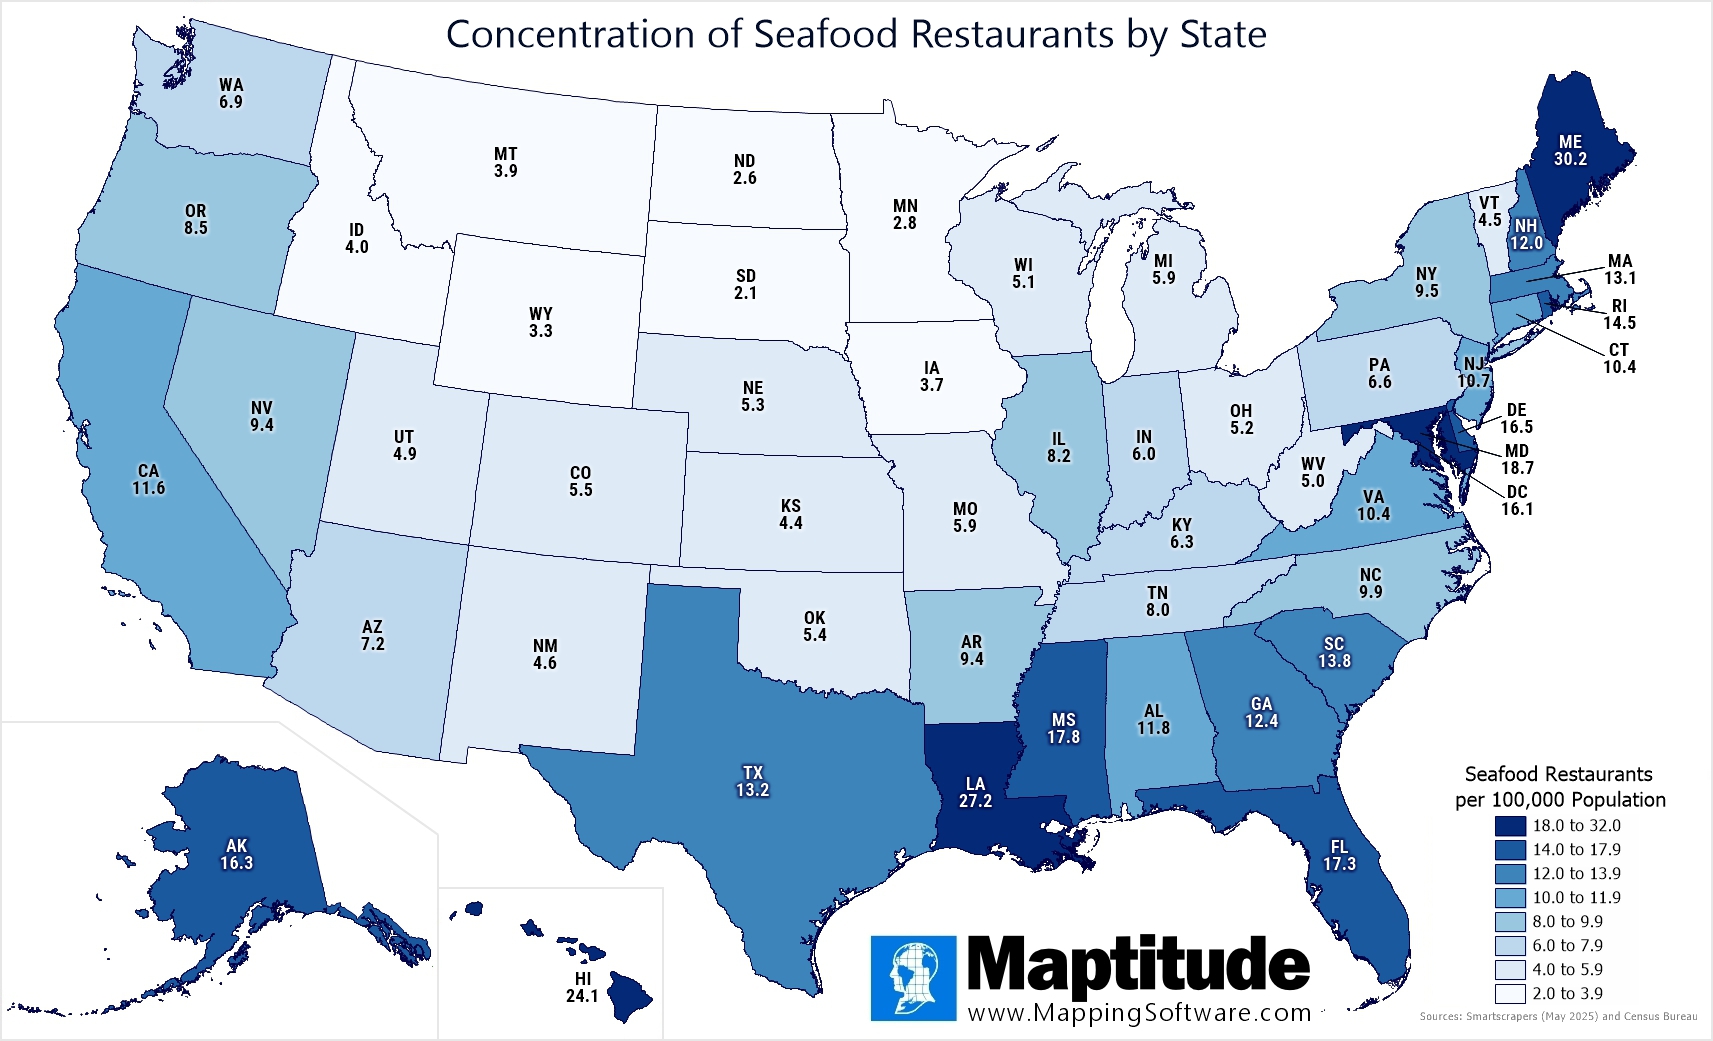
For National Seafood Month (October) we mapped the concentration of seafood restaurants by state. Nationwide, there are 10.25 seafood restaurants per 100,000 population with the highest concentration in Maine (30.2/100,000), Louisiana (27.2), Hawaii (24.1), and Maryland (18.7). Not surprisingly, states far from a coast, South Dakota (2.1), North Dakota (2.6), and Minnesota (2.8), have the lowest concentration.
Map: Created with Maptitude Mapping Software by
Caliper, October 2025
Sources: Smartscrapers and U.S. Census Bureau
#Maptitude #NationalSeafoodMonth #SeafoodRestaurants
Home | Products | Contact | Secure Store
