Last Updated: March 5, 2025
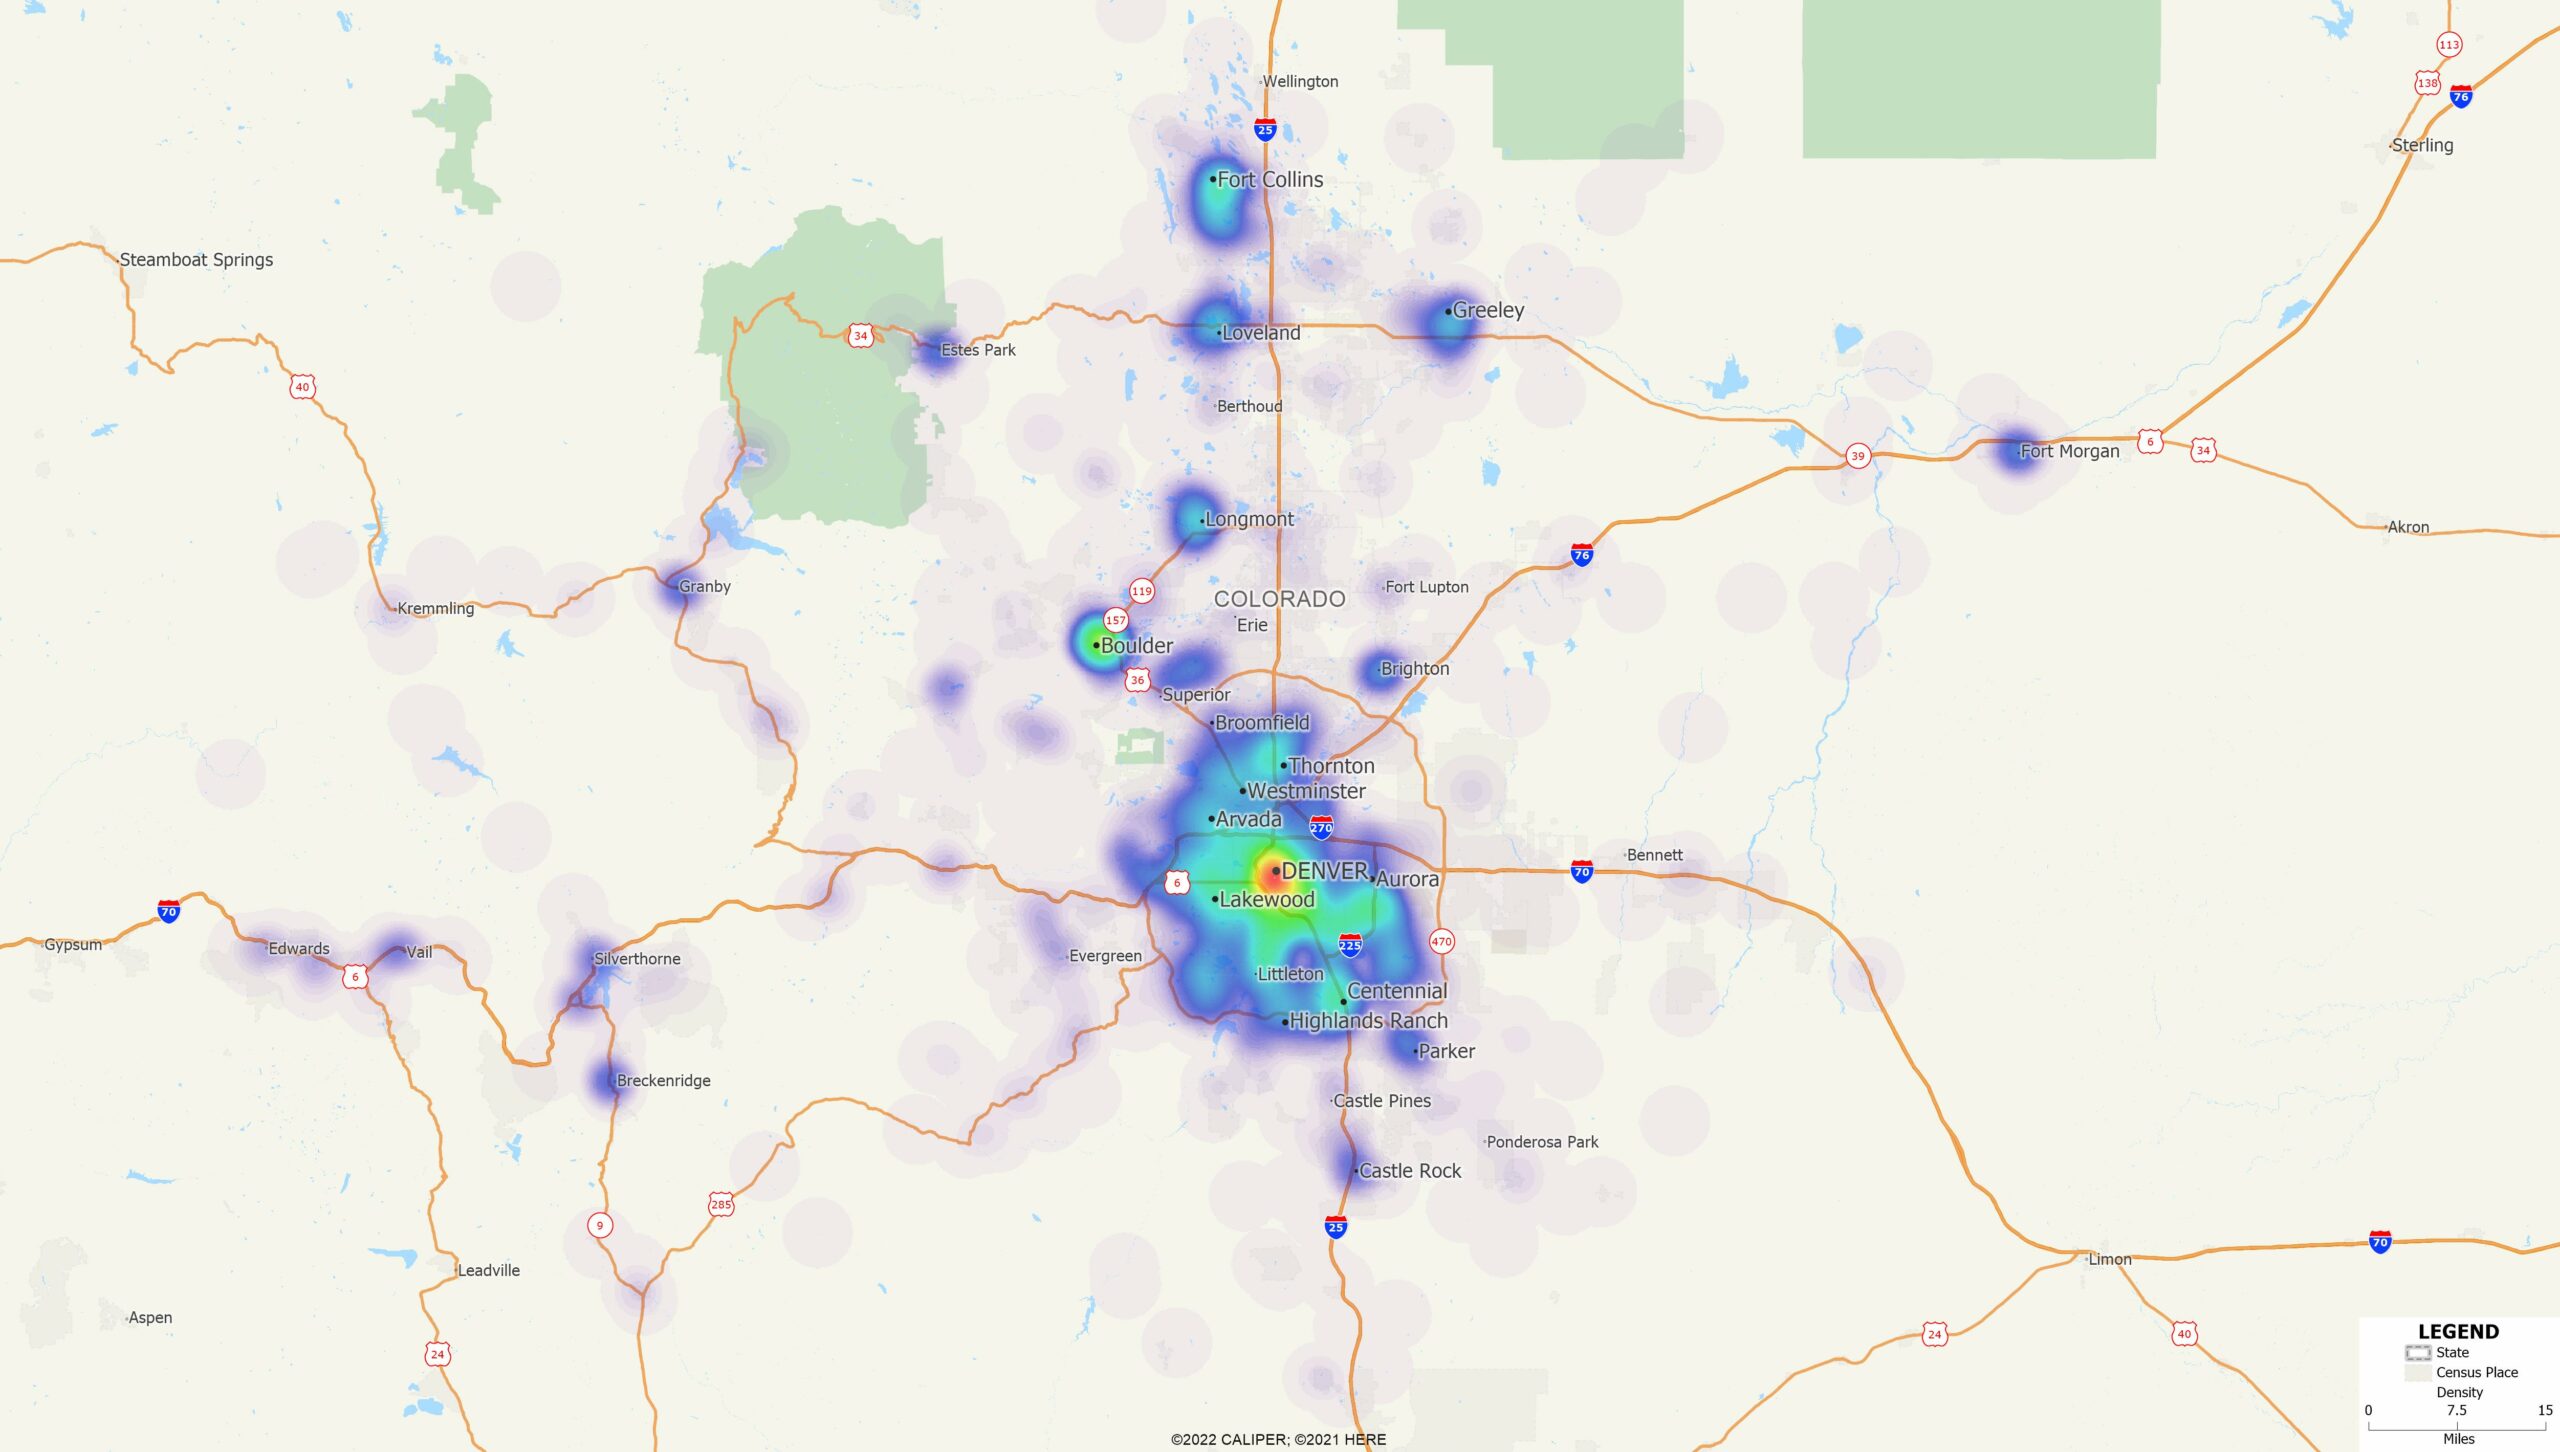
The Density/Heat Layer, or Density Grid, is a tool used to identify areas of a point layer with both high and low concentrations of points. Creating a density grid adds a new layer to the map called Density. The Density layer is actually a grid layer with a color theme applied to it, so the colors can be customized using the Color Theme tool. The steps below will go over how to change the color scheme of the density grid, as well as do some custom formatting.
- To begin, you’ll need a density grid already on the map. For steps on creating the density layer, you can follow this video or this article.
- Now that you have your density grid, right click on the Density layer and choose Make Working Layer.
- Choose Color Theme from the main toolbar.
- Click the Styles tab, the color theme for the density grid is shown.
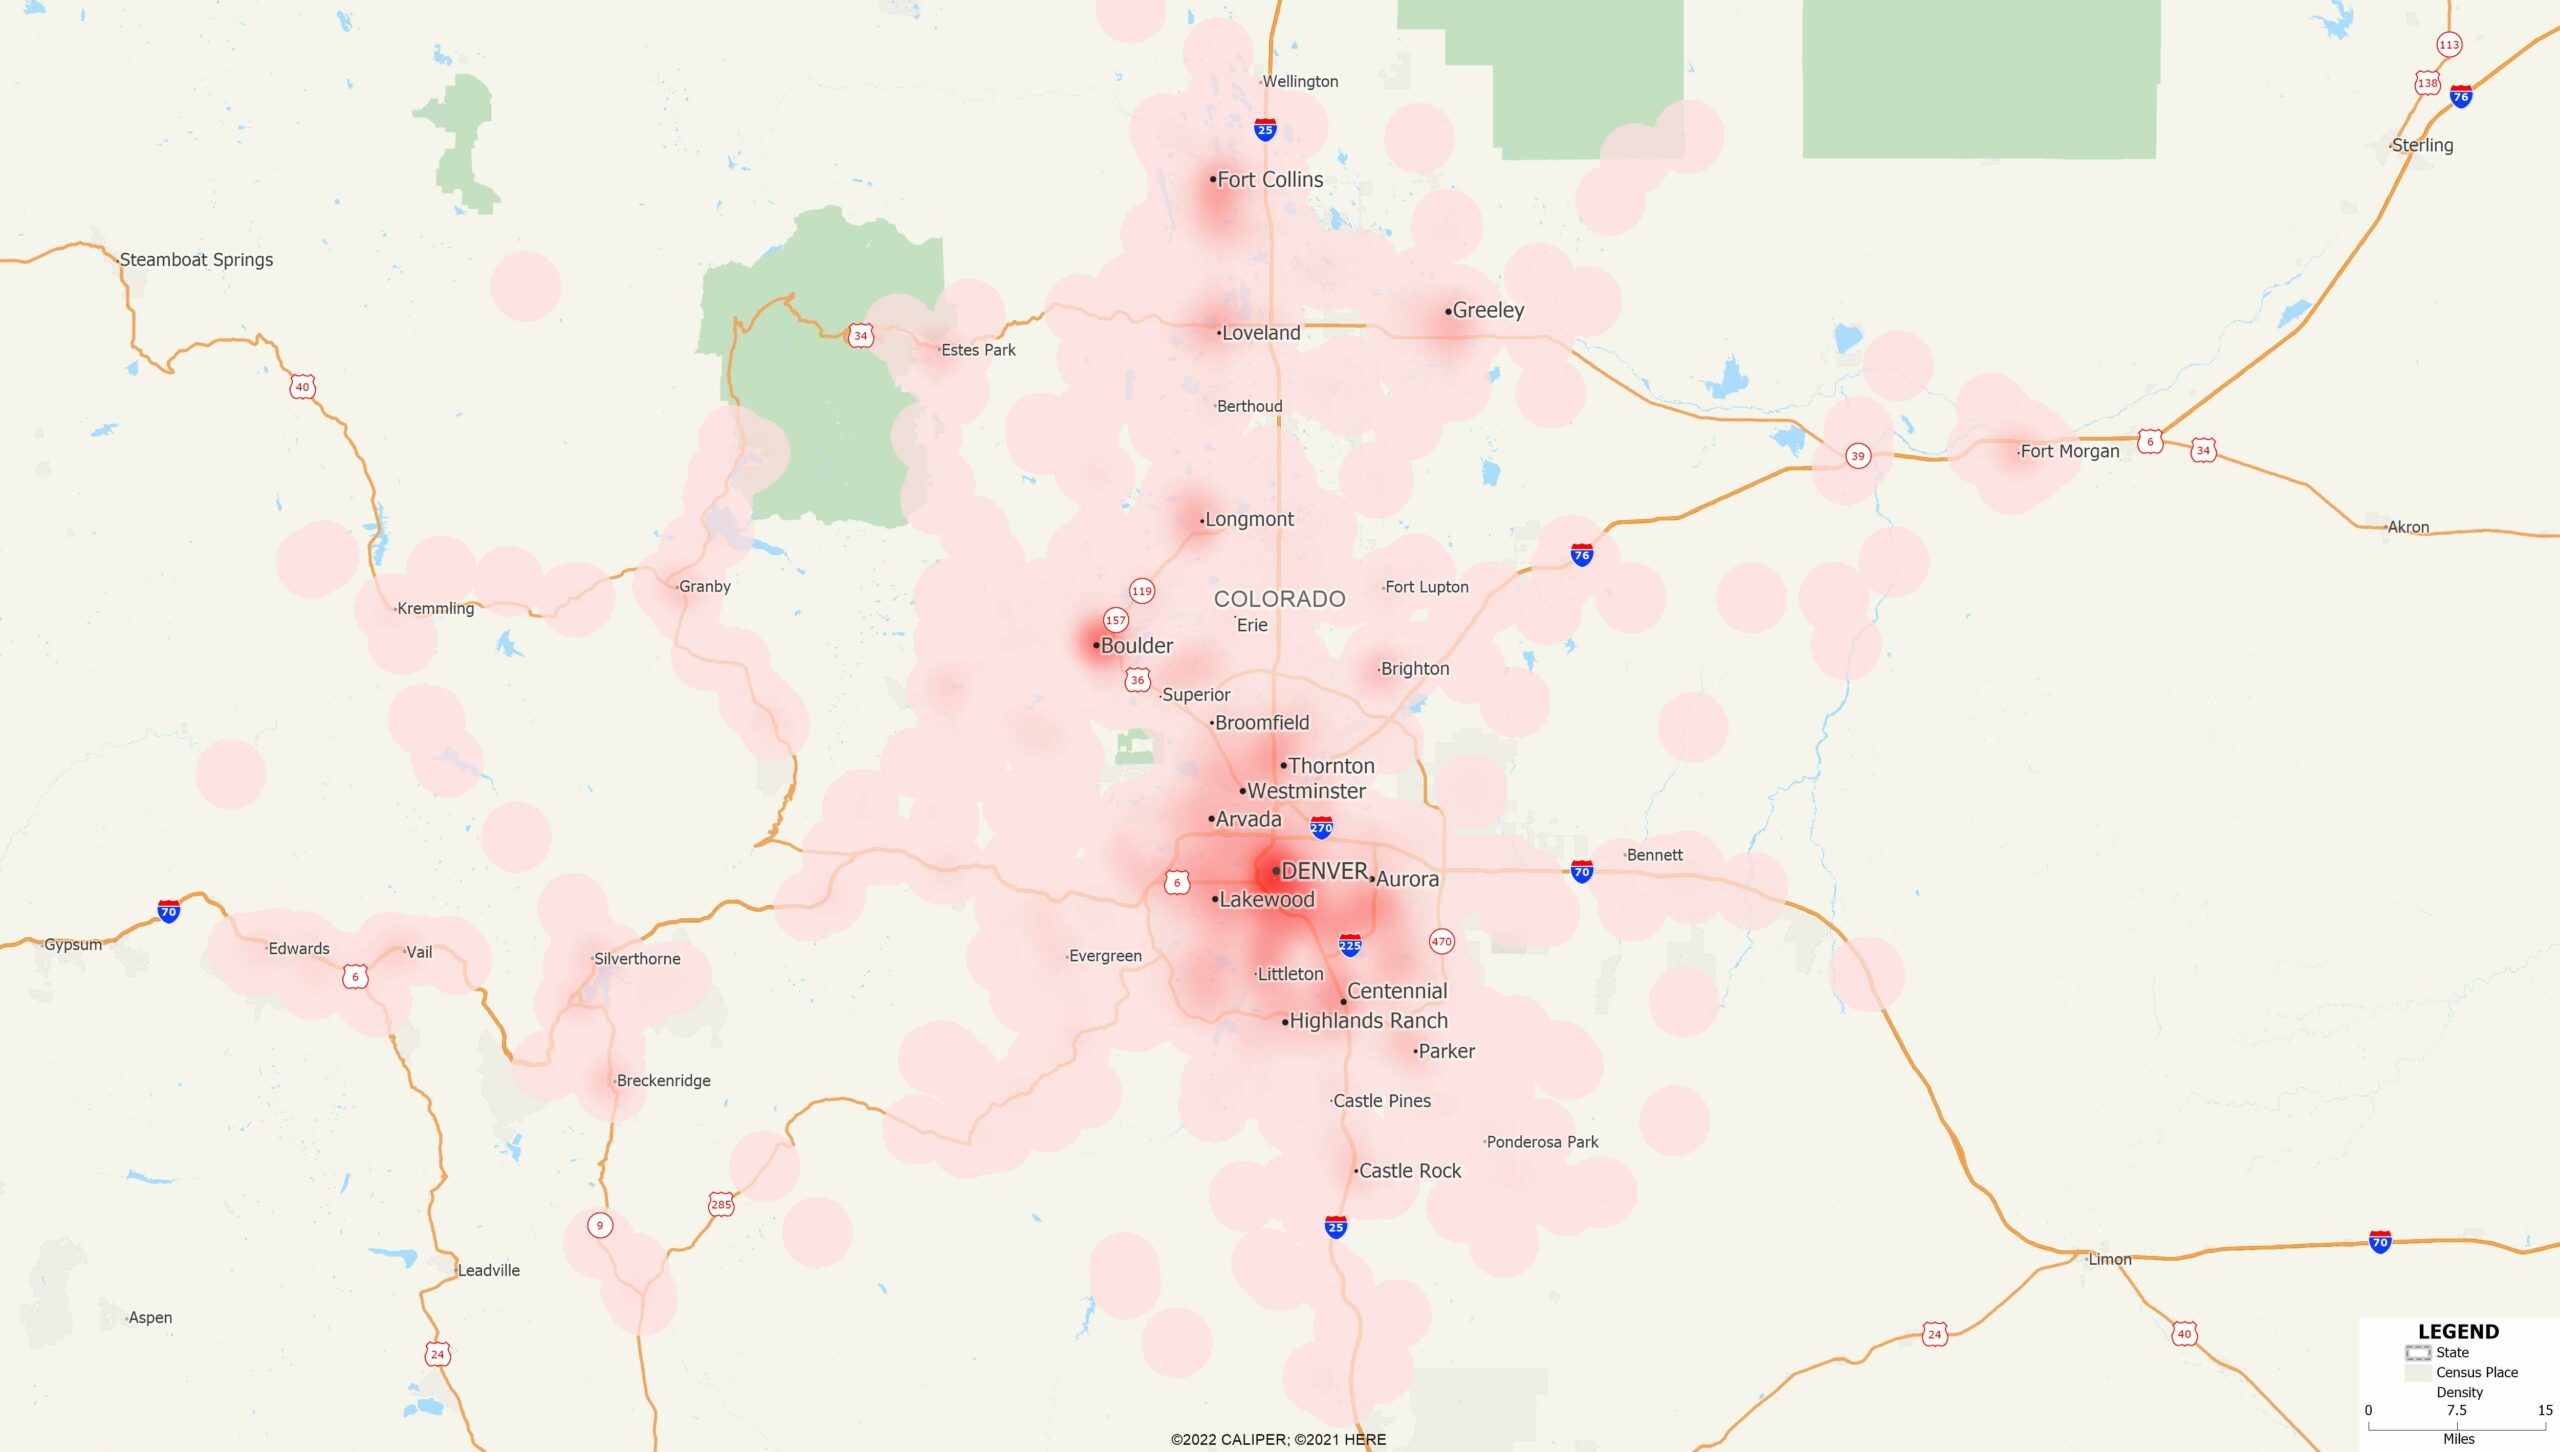
- To cycle through the different color palettes, click the Next and Previous buttons.
- In some color schemes, the Other category will turn solid white. You can change this to transparent by highlighting Other in the Choose a class list, clicking Style, and changing the Fill Style to None.
- Optionally, you can make your density layer transparent by following these steps:
- Highlight the class right below Other and click Style.
- Change the Fill Opacity to a value you are happy with (0 is totally transparent while 100 is completely solid).
- Click OK and click Copy Pattern to apply the opacity to all other classes in the theme.
- Once you are happy with the color scheme, click OK.