Last Updated: June 25, 2025
You can create a density or heat map of your locations using geographic heat mapping software.
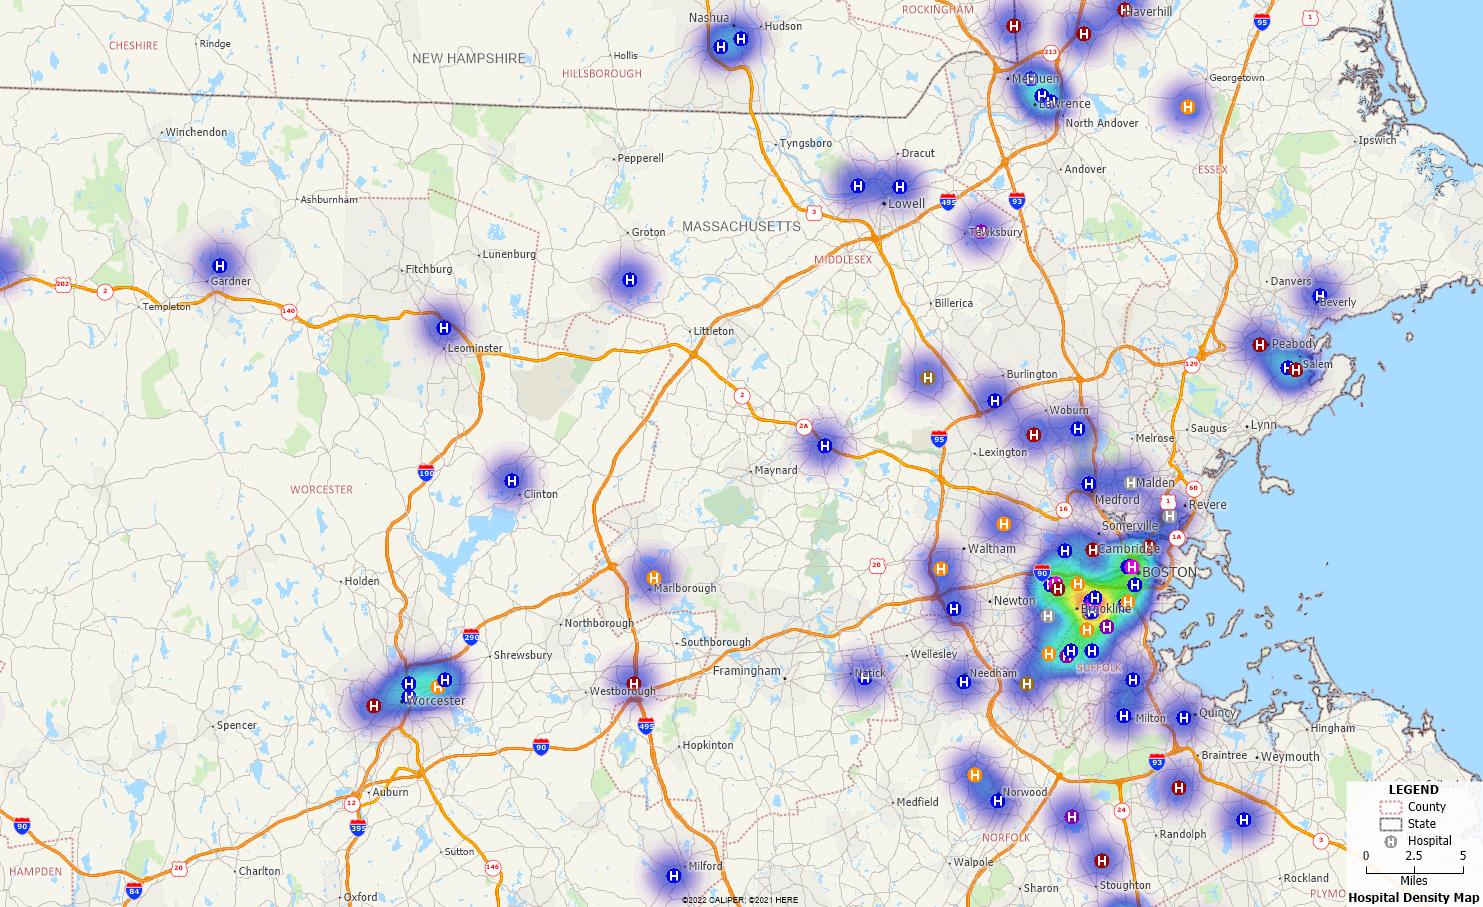
Density grids are a powerful tool that you can leverage to visualize your data. For example, it can be useful for showing hot spots of crime, mapping the concentration of healthcare providers, and analyzing the pattern of clients around a store weighted by the cost of their purchases.
This article shows you how to work with the Density/Heat Layer tool in Maptitude. If you are looking to instead shade your points or areas with different colors, please see the tutorial article on creating color theme maps in Maptitude.
Creating a Density or Heat Map in Maptitude Desktop
- Download a free mapping software trial of Maptitude Desktop or use your existing Maptitude Desktop license.
- Add your data as points on the map by following the video tutorial on mapping your own data in Maptitude.
- Choose Tools>Analysis>Density/Heat Layer or click
 on the Standard toolbar.
 - Choose the layer containing your data from the Layer drop-down list and choose Visible Features from the Set drop-down list.
Note: You can also limit the density/heat layer using selection sets.
- Enter a name for the density grid layer, such as “My Density,” in the Layer Name edit box and click OK.
Creating a Density or Heat Map in Maptitude Online
- Request a free mapping software trial of Maptitude Online or use your existing Maptitude Online account.
- Click Create Map at the top of the page.
- You can copy and paste the data you would like to map directly into the table.
Or, click Browse and select your Excel file and Sheet that you would like to map.
Click Next. - Use the drop downs to properly configure your Excel columns. Click Next.
- Select one of the Locate options to see your data as points on the map.
Click Next. - Select the Heat Map Theme and click Next.
- If you are mapping your data as points, you can optionally add one of the following analyses: buffers, weighted center, and areas of influence.
For more information on the analyses options, please see:
Tutorial video on the buffer analysis in Maptitude.
Tutorial article on the weighted center analysis in Maptitude.
Tutorial video on areas of influence in Maptitude. - Enter a name for the map and click Finish.
Maptitude computes the density grid and adds it to the map. The density at any location can be visualized by the color of the shading – usually blue to red for low to high density.
For more information on creating heat maps, please see the Maptitude video tutorial on heat maps.
For a tutorial on changing the color of your density grids, please see the Maptitude article on customizing heat maps.
For an example geographic analysis making use of density grids, please see the Maptitude article on analyzing Albertsons and Kroger locations.