Last Updated: March 5, 2025
You can create bivariate maps using thematic mapping software.
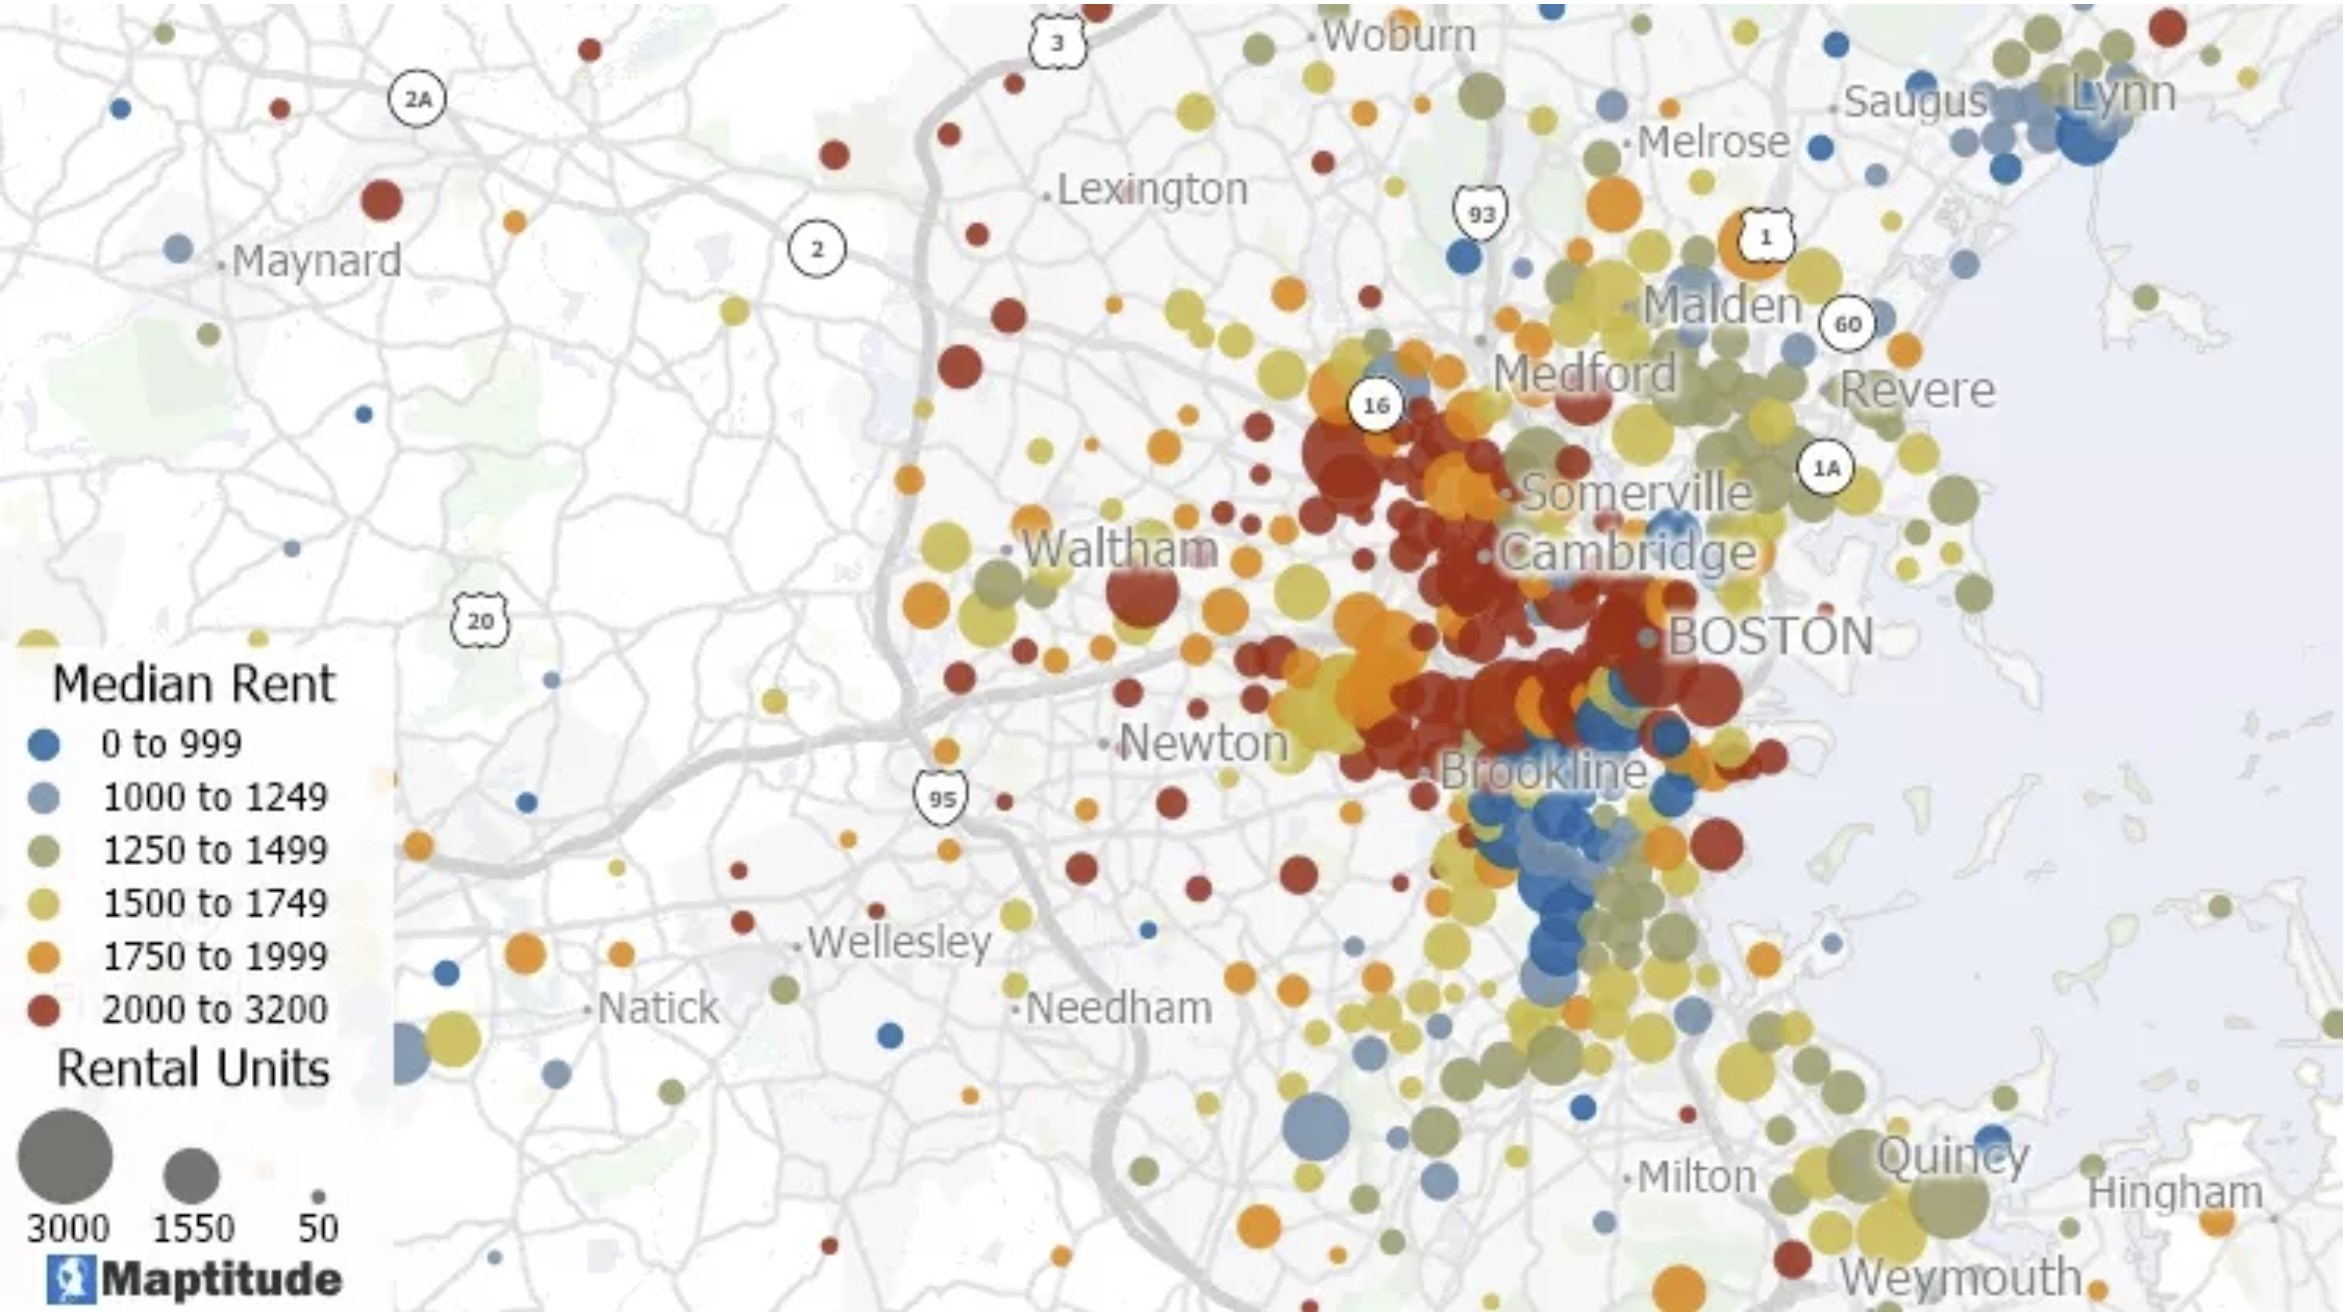
Showing two attributes in the same map is easy with Maptitude using both color and size. A map can show any number of themes and can even combine several types of themes on a single layer such as a sales territory layer with a color theme of total annual sales and a size theme showing sales for this quarter.
For example, if you want to explore the pattern of high-income households, size can show the total number earning over $100,000, while the color can highlight where the highest percentage exist. This method highlights areas that have both a high count and percentage of affluent households.
In general, to spot patterns more rapidly in a bivariate thematic map:
- Use a normalized variable for the color theme (an average, ratio, or percentage)
- Use a count variable for the size theme
You can also create bivariate maps using a plurality theme, which shows your attributes as two simultaneous color ramps.
See also: