GIS for Local Government: Economic Development


Authors:
Brett Lucas
and Stewart Berry
Introduction
This article explores how to use
GIS in local or Municipal Government. Many local governments are
being asked to have a more transparent relationship with their
citizens, which has been supported by technologies like
geographic information systems (GIS) and other data
visualization tools which allows communities to manipulate, analyze,
and present data in a geographic form. GIS as a tool, can help local
government decision-makers, policymakers, and others visualize data
for a variety of applications.
This could include:
- Identifying potential areas for business development and expansion
- Creating detailed maps to analyze demographic data and identify potential markets
- Estimating the impact of new investments
- Analyzing transportation and infrastructure needs
- Creating 3-D models to visualize the effects of zoning changes
As a local government, utilizing GIS can help you better
communicate that data through a visual component. Many local
governments have found ways to leverage geospatial data across an
organization in areas like building permit inspections, code
enforcement, and street repair.
GIS Software for Government
Maptitude mapping software is an ideal software platform
for local governments (especially smaller municipalities on a tight
budget at only $795) to leverage geospatial data across an
organization. Maptitude is a full featured desktop or
online GIS and mapping software that gives you the tools, maps,
and demographic data to analyze and understand how geography affects
you and your community.
In this article we will demonstrate an application of Maptitude
in the municipal government sector for
economic development
and
site selection.
Economic Development – What is the best site for a fast-food restaurant?
For this example, we will be using the City of Austin, Minnesota.
A multi-state quick service restaurant ("QSR" or fast-food chain)
would like to open some new locations in Minnesota. They believe
Austin, a community of 26,000 people located off I-90, would be an
ideal site. The Economic Development team in the city has been
tasked to do some facility location work to see if there are sites
that meet most of the requirements of the QSR:
- Site size – Greater than 25,000 Square Feet or approximately
0.55 acres
- Night population – 10,000 people with in a 1-mile radius
- Daytime population (employment) – 3,000 people within a
1-mile radius
- Average or Median Household Income – $65,000 within a 1-mile
radius
- Annual Average Daily Traffic (AADT's) – 25,000
These are the steps to perform the analysis in Maptitude:
-
Download a free mapping software trial of Maptitude Desktop
or use your existing Maptitude Desktop license.
- Start Maptitude and choose "New
Map of the United States", click OK, choose "U.S. City", type
"Austin, MN", and click Finish. A map zoomed into Austin
Minnesota is displayed.
- You may want to turn
on aerial photography (three choices are available in
Maptitude).
- Add a tax parcel area layer (in
this example, we used
a Shapefile that was available from Mower County). To add
new layers to your map, choose Map > Layers… > Add Layer to
bring in a geospatial layer (point, line, or polygon) such as a
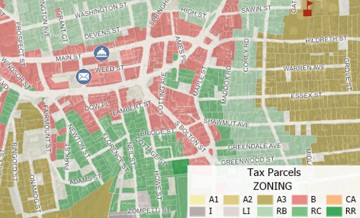
Shapefile. The result should resemble Map 1.
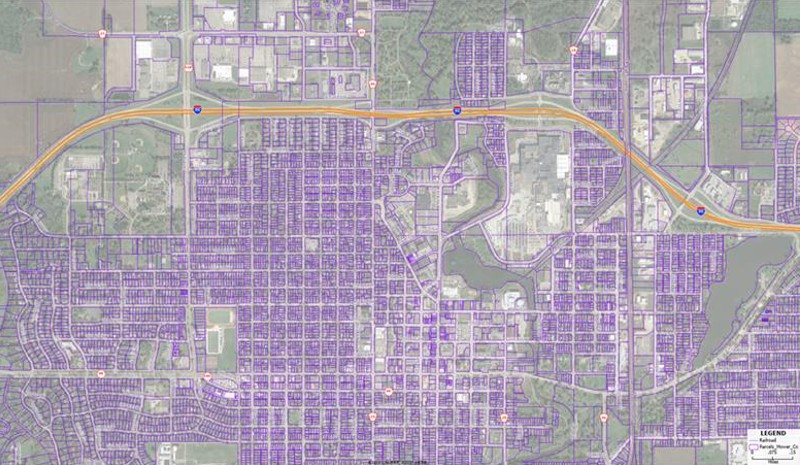
Map 1: Maptitude map of Austin, MN with parcel boundaries
- We are interested in filtering on
sites (parcels) that are designated with a zoning of
"Commercial" and that have a size greater than 0.55 acres or
25,000 square feet. We can do that using
Selection Sets.
- Using the "Selection Toolbar" click "Create New
Selection" and click OK.
- Choose Selection > Select by Condition. Type:
ClassDescr = "COMMERCIAL". In this case, the field is "Class
Description", the operator is "=" and the field value is
"Commercial". Click OK.
- Using the "Selection Toolbar" click "Create New Selection" and click
OK.
- Choose Selection > Select by Condition.
Type: DeededAcre >= 0.55. The window should resemble Figure
1. Click OK. The result should resemble Map
2.
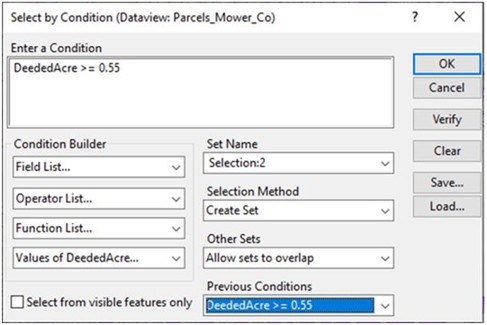
Figure 1: Select by Condition window
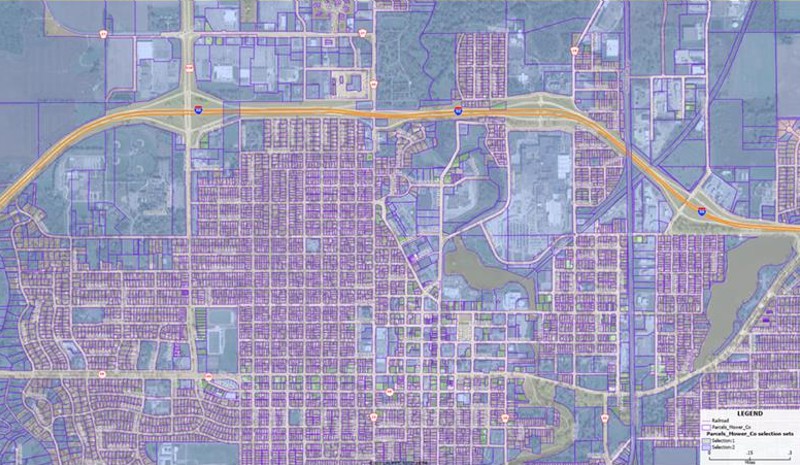
Map 2: Maptitude map showing Selection sets 1 and 2
- What we really want are sites
that meet both the criteria of being zoned Commercial and over
0.55 acres in size. To do that we need to combine Selection
Sets.
- Using the "Selection Toolbar" click "Create New
Selection" and click OK.
- Choose Selection > Combine Selection
- By
- Choosing features in both
- Selection:1
- Selection:2
- The window should resemble Figure 2. Click OK.
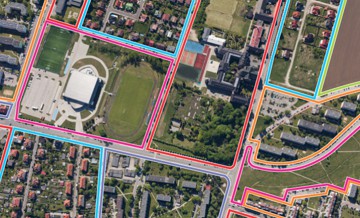
The result should resemble Map 3.
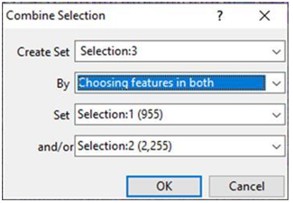
Figure 2: Combine Selection window
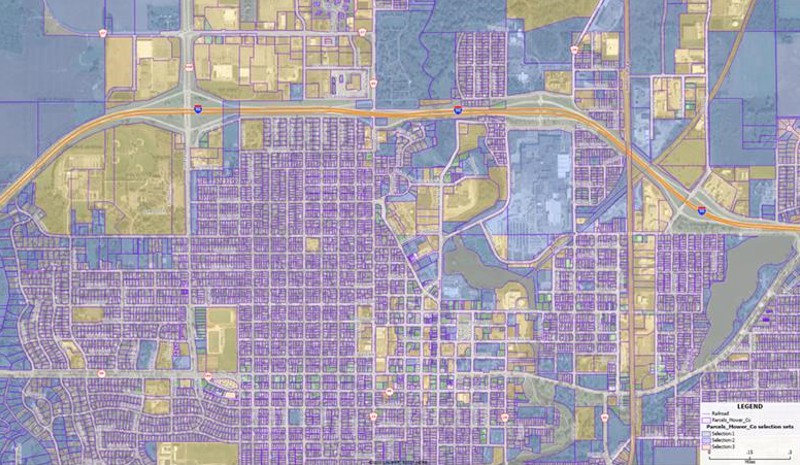
Map 3: Maptitude map showing the combined selection set in yellow
- Use Map > Add Layer to add 3
layers to the map:
- "Block
Groups" (this has our demographic and socioeconomic
data)
- "Traffic
Counts"
- "Highway
Exits"
- Hide the Block Group layer using
the Display Manager.
- Make "AverageDailyTraffic" the
Working Layer.
- Choose Map > Thematic
Mapping > Color. Click Remove.
- Choose Map > Thematic
Mapping > Size.
- Under Symbol Sizes,
choose "Manual". For the Low Value type "1,000"
and type a Size of "1". For the High
Value type "25,000" and type a Size of
"12". The window should resemble Figure 3. Click OK.
The result should resemble Map 4.
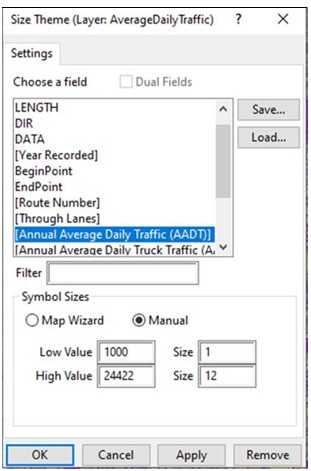
Figure 3 – Size Theme window
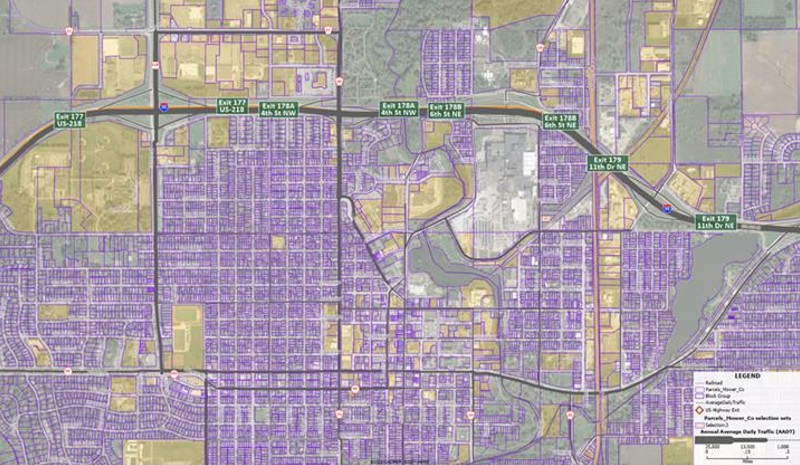
Map 4: Maptitude map showing combined Selection Sets, exit numbers, and traffic counts (AADT) as a graduated symbol
- Next, we want to identify our
short list of three potential sites. We will create a new layer
called "QSR Sites".
- Choose Tools > Editing > New Layer.
Choose "Point Layer". Name the new layer "QSR Sites". Choose
"Add the layer to the current map window". Click OK.
- Modify the layer and add fields to describe the QSR
Sites (i.e., site name or number, etc.). This will make it
easier to identify sites in the Output Reports. The result
should resemble Figure 4. Click OK.
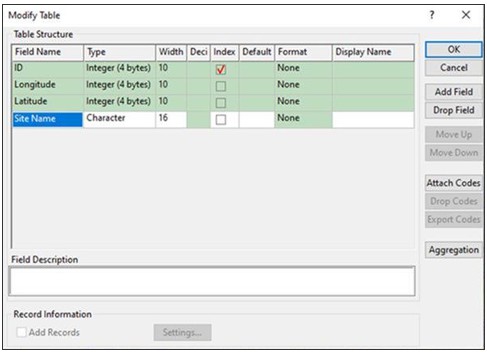
Figure 4: Modify Table window
- In the Display Manager, for layer
"QSR Sites", click the point style icon. Change the style to be
a circle of size 8 and color red. Click OK.
- Using the "Layer Editing Toolbar"
choose the "Add point" button. Click on the map to place your
shortlist of three locations. Click the "green light" button.
Use the "Edit Point Attributes" button to click on each location
and to type a site name. Click the "green light" button.
- For the "QSR Sites" layer in the
Display Manager click on the white "label" icon to choose [Site
Name] as the label field, and a color and size for the labels of
each location. The result should resemble Map 5.
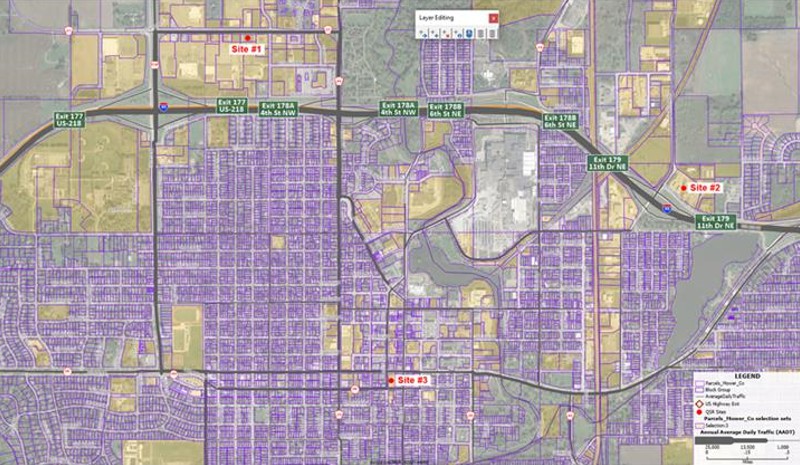
Map 5: Maptitude map showing the three possible sites
- Now that we have potential site
locations identified from available real estate or green or
brown field sites (e.g., Exit 177/I-90 near fast food row, Exit
#179/I-90 at the truck stop/travel plaza, and downtown on the
business loop) we need to draw a 1-mile radius around each
location and pull in some demographics.
- Choose Tools > Analysis
> Buffers. Choose for Sizes 1
Miles, choose Separate Buffers, and for Buffer
Names From choose [Site Name] so we can identify
each location in the Buffer Report. Choose Calculate
Demographics and Create Report.
The result should resemble Figure 5.
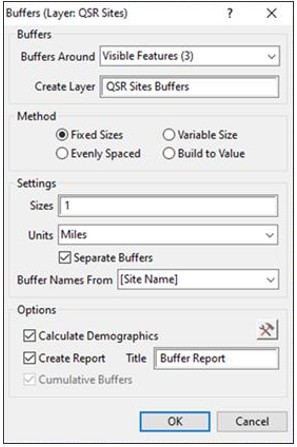
Figure 5: Buffer window
- Click on the Configuration button
to adjust the demographic settings. Choose Overlay with
Layer "Block Group". Next click on the first "gear"
icon to edit the attributes and the method to aggregate the
data. For "Median Age" check the box for "Average". The result
should resemble Figure 6.
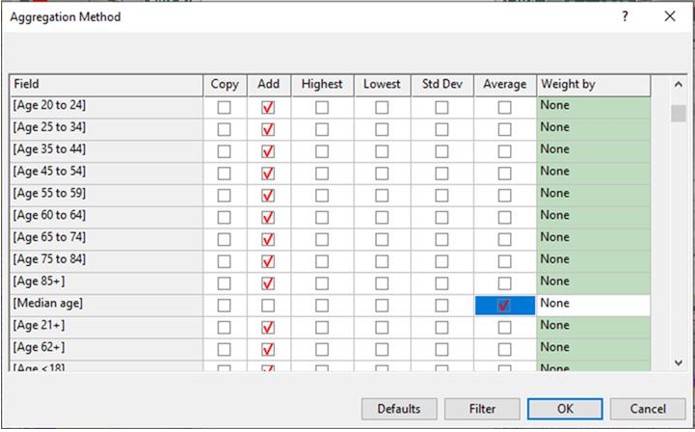
Figure 6: Attribute/Aggregation window
- Click OK, click
OK, click OK.
- Once the buffers are created the
result should resemble Map 6. In the Display Manager adjust the
colors of the "QSR Sites Buffers" layer as appropriate.
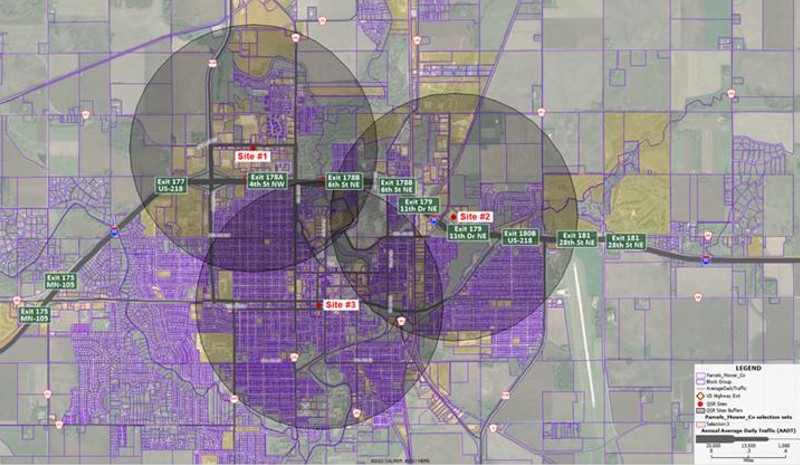
Map 6 – Maptitude Workspace with one-mile buffers around each location
- Let’s look at the report as shown
in Figure 7. This report was opened as a separate window outside
of Maptitude when we ran the buffer analysis. Average household
income for Site #1 meets the $65,000 requirement. In terms of
"Daytime Age 18+" (daytime population), all three candidate
sites meet the minimum 3,000 people threshold. In terms of night
population, only candidate site #3 meets the 10,000-population
minimum.
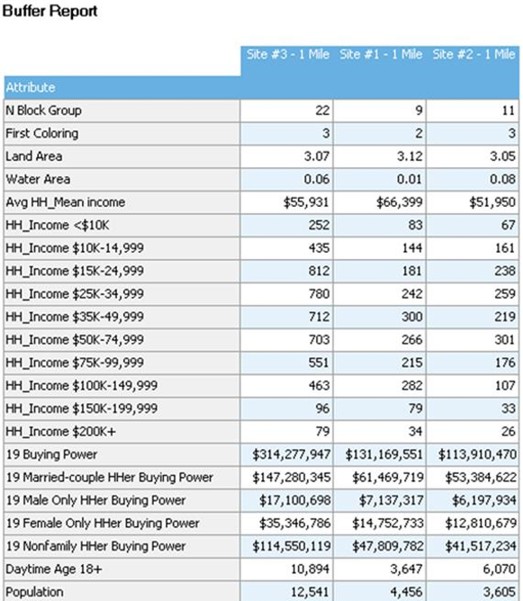
Figure 7: Buffer Report output
- Next, we want to look at traffic
count data and see which of the candidate sites meet those
requirements. To do that we will create an Overlay.
- Make "QSR Sites Buffers" the Working Layer. Choose
Tools > Analysis > Overlay. Make choices as shown in Figure 8.
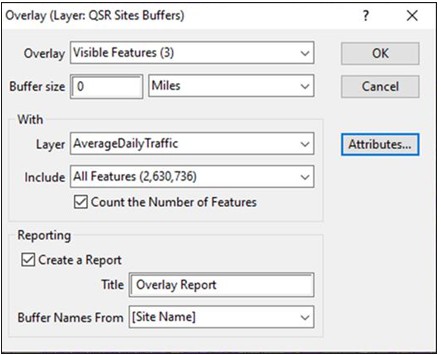
Figure 8: Overlay window
- Click Attributes.
Make choices as shown in Figure 9. Click OK.
Click OK.
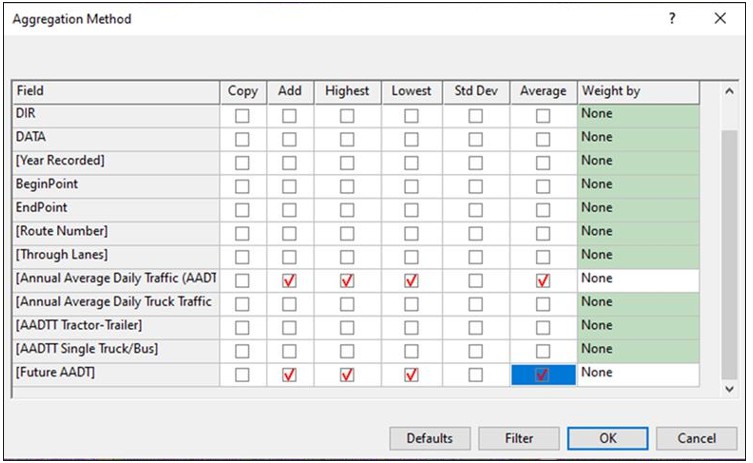
Figure 9: Aggregation window
- Let’s look at the report as shown
in Figure 10. This report was opened as a separate window
outside of Maptitude when we ran the overlay analysis. The QSR
Company did not indicate a distance around each location in
terms of the AADT capture area. So, we assume a 1-mile radius.
As we can see from the Overlay Report, all three candidate sites
met the "highest" annual traffic count of 24,000 with site #1
having the highest daily average at 6,197.
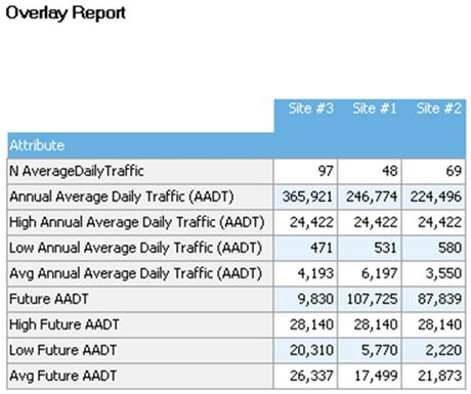
Figure 10: Overlay report
- As an alternative to doing 1-mile
buffers, one could do a 3-to-4-minute Drive-Time Ring which
would closely approximate a 1-mile buffer. Drive-Time rings are
based on the road network, so they are more realistic than a
buffer.
- Make "QSR Sites" the Working Layer.
- Choose Tools > Routing & Directions > Drive
Time Rings.
- Setup as shown in Figure 11. If you click the "gear"
Icon, you could create an overlay with appropriate
demographics, like we performed with the buffers created
earlier.
- Click the "Create Drive Time Rings" button. The result should resemble Map 7.
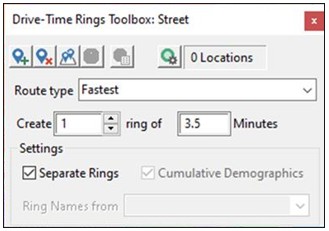
Figure 11: Drive-Time rings window
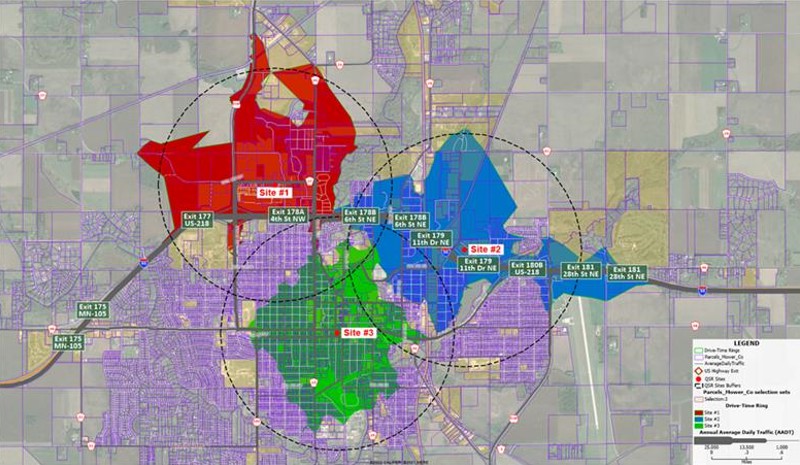
Map 7: Maptitude map with 3-minute Drive-Time Rings
Conclusion
After reviewing the different output reports, we can see that
candidate Site #2 least meets the requirements. If the QSR Company
is most interested in travelers coming through town, then candidate
Site #1 may be the best location. If the QSR company is most
interested in serving local customers, then candidate Site #3 may be
the better location. No site meets all the requirements, so further
criteria may need to be applied to determine the best candidate site
for a new QSR.
Maptitude is an extremely powerful software package for municipal
governments for economic development. For example, it allows an
analyst to target certain areas of a community for enhanced economic
development initiatives.
Next Steps
Learn more about Maptitude to see how you and your team can benefit from mapping software!
Schedule a Free Personalized Demo
Free Trial Buy Now