Last Updated: December 19, 2025
You can create heat maps in Maptitude mapping software using custom territory layers to visualize data grouped by sales regions, service areas, or other user-defined boundaries. While heat maps are often created using standard geographies such as ZIP Codes or census areas, Maptitude also allows you to generate heat map-style thematic maps directly from territory layers. In this guide, we will walk through how to create a heat map using territories in Maptitude by adjusting territory display settings and applying a color theme.
Table of Contents
1. Download and Install Software
2. Prepare the Territory Layer
3. Create a Heat Map Using a Color Theme
Step 1 Download and Install Software
- Download and install a free trial of Maptitude mapping software, or use your licensed copy of desktop Maptitude.
Step 2: Prepare the Territory Layer
Before applying a heat map, you must adjust the display settings of your territory layer so the color theme can be shown correctly.
- Load the workspace containing the territory layer you want to use or build a territory map using the Territory Wizard. Make sure the field you want to base the heat map on is added as a tracking field.
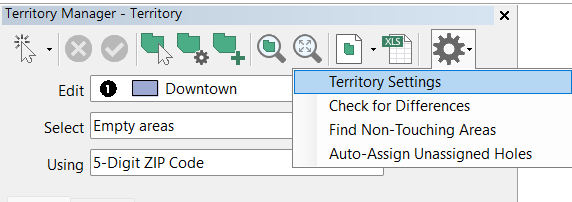
- Open the territory layer’s settings and go to the Map tab.
- Change the territory fill option to None, then click OK.
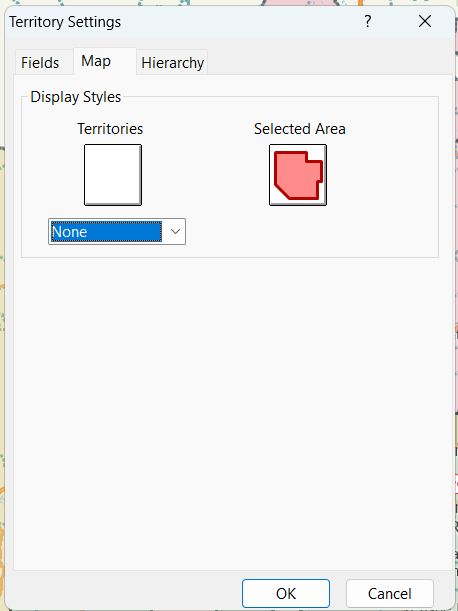
Removing the fill allows you to add a color theme to the territories, creating the heat map effect.
Step 3: Create a Heat Map Using a Color Theme
Once the territory layer is prepared, you can apply a color theme to generate a heat map.
- Set the territory layer as the working layer
- Click the Color Theme icon on the toolbar.
- Choose the field you want to visualize, such as sales totals, case counts, or customer volume.
- Select a light-to-dark color ramp to represent low-to-high values.
- Click OK to apply the color theme to your territories.
Your territories will now be shaded based on data intensity, producing a heat map-style visualization grouped by territory.
Tips and Notes
- This method will rely on you having tracking fields for your layer. Without the tracking fields, the color theme will only be able to run on the area field.
- You can refine the heat map by adjusting classification methods and break values in the Color Theme settings.
Conclusion
Creating a heat map using territories in Maptitude allows you to visualize patterns and performance across custom-defined regions. By preparing the territory layer and applying a color theme, you can quickly identify high- and low-performing areas and make more informed business, planning, or operational decisions.