Last modified by - 2 months ago
885 Views
4 min read
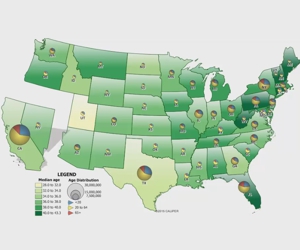
Three commons ways to visualize time series data in a Maptitude map, explored using the Population Projections data included with Maptitude
Last modified by - 2 months ago
352 Views
1 min read
How to reinstall Microsoft Print to PDF in Windows 10 so that you can use the Export to PDF option in Maptitude
Last modified by - 2 months ago
479 Views
1 min read
How to use the Export to Excel function to generate a report of the Healthcare locations nearby a given location
Last modified by - 2 months ago
492 Views
Less than a minute read
You can export your maps as Animated GIFs to show change over time. Go to File>Share>Animated GIF and add each frame individually to the GIF before you save.
Last modified by - 2 months ago
395 Views
1 min read
Last modified by - 2 months ago
567 Views
Less than a minute read
You can export demographic overlay data and other information to Excel by choosing the layer to export, making it the working layer, and clicking the Export to Excel button on the Standard toolbar.
Last modified by - 2 months ago
2050 Views
1 min read
You can export demographic overlay data and other information to Excel by choosing the layer to export, making it the working layer, and clicking the Export to Excel button on the Standard toolbar.
Last modified by - 6 months ago
586 Views
Less than a minute read
Saving Maptitude maps to different graphic file formats and using Maptitude maps in other applications
Last modified by - 6 months ago
1887 Views
Less than a minute read