Last Updated: August 6, 2025
Spatial Autocorrelation is a measure of how likely two neighboring areas are to have similar values for a specific field of data.
You can calculate Spatial Autocorrelation using GIS Software.
Spatial Autocorrelation is measured using the Moran’s I Statistic, which varies between -1 and 1.
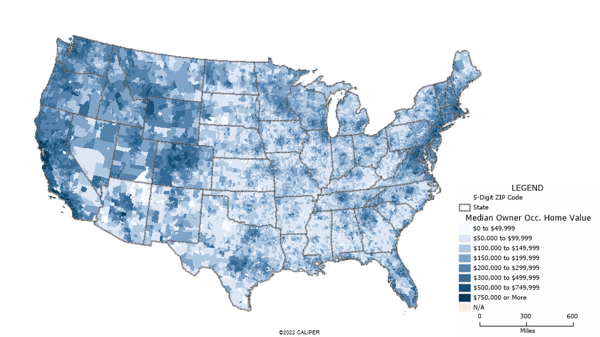
Values close to 1 represent strong positive autocorrelation. For instance, if we were looking at housing prices across ZIP Codes, we would expect to see strong positive autocorrelation, since ZIP codes with high House values tend to be close together.
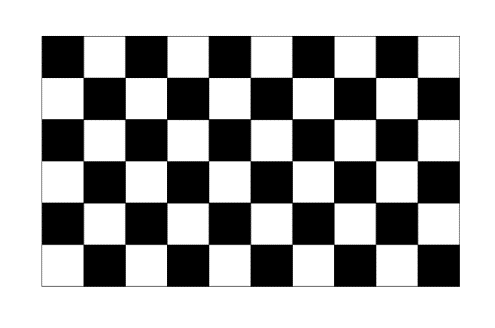
On the other hand, Values close to -1 represent negative autocorrelation. This is quite rare in practice but can be visualized by thinking of a chessboard – each square surrounded by neighbors of a different color.
Finally, values close to zero represent no autocorrelation. This means that the value for that field is not affected by the values for the areas around it.
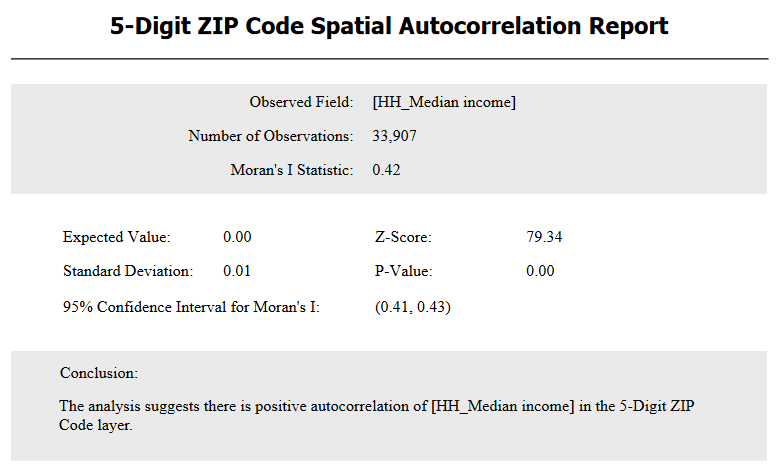
With Maptitude mapping software, you can create a report that shows you Moran’s I Statistic.
- Download and install a free trial of Maptitude mapping software, or use your own license of desktop Maptitude.
- Make the area layer you are interested in the working layer.
- Go to Dataview>Statistics>Spatial Autocorrelation.
- Choose the data field you want to consider from the Field drop down.
- Check Create report and click OK.
Maptitude generates a report indicating Moran’s I Statistic for the specific data field in the area layer.
For more geographic analysis options available in Maptitude, please see: https://www.caliper.com/learning/tags/geographic-analysis/