10 October 2025
A Geographic Information System (GIS Software) is designed to store, retrieve, manage, display, and analyze all types of geographic and spatial data. GIS software lets you produce maps and other graphic displays of geographic information for analysis and presentation.
Ad Maptitude is the lowest-priced, easiest-to-use professional GIS software available. For more information about Maptitude please visit our Maptitude Mapping Software pages. Otherwise, please read on to explore the GIS capabilities of Maptitude.
Free Trial Request Demo Subscribe
GIS software lets you produce maps and other graphic displays of geographic information for analysis and presentation. With these capabilities a GIS is a valuable tool to visualize spatial data or to build decision support systems for use in your organization.
 A
Geographic Information System (GIS) stores both the geometry (shape
and location) and attributes (descriptive information) of geographic
features using vector and raster data models. Vector data represents
features as points, lines, or polygons, for example, cities as
points, roads as lines, and postal code boundaries as polygons.
Raster data represents features as cells in a grid, often used for
images such as aerial photos or scanned maps. This structure allows
GIS to capture both the spatial layout and the characteristics of
geographic features for analysis and mapping.
A
Geographic Information System (GIS) stores both the geometry (shape
and location) and attributes (descriptive information) of geographic
features using vector and raster data models. Vector data represents
features as points, lines, or polygons, for example, cities as
points, roads as lines, and postal code boundaries as polygons.
Raster data represents features as cells in a grid, often used for
images such as aerial photos or scanned maps. This structure allows
GIS to capture both the spatial layout and the characteristics of
geographic features for analysis and mapping.
Geographic Information Systems store information using spatial indices that make it possible to identify the features located in any arbitrary region of a map. For example, a GIS can quickly identify and map all of the locations within a specified radius of a point, or all of the streets that run through a territory.
In addition to the above capabilities, Maptitude GIS software includes a professional-grade relational database, a critical component for advanced geographic information system (GIS) analysis. With this database, attribute data may be freely joined to and detached from geographic layers and tables. Relational data manipulation is integrated with robust and powerful geoprocessing for spatial queries, polygon overlay, and other location-based analyzes. This is supported seamlessly so that data are moved easily to and from relational tables and geographic databases. In addition, the Maptitude fixed-format binary table supports 32,767 fields and 1 billion records, and has unlimited character field widths.

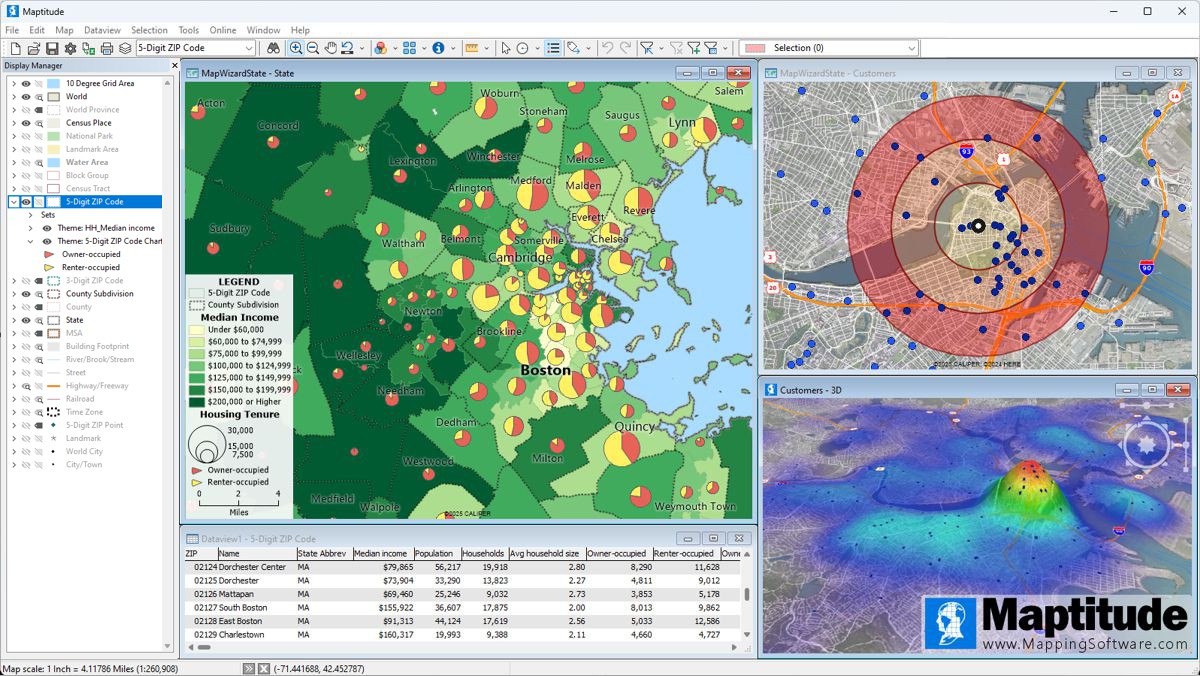
Maptitude is one of the most popular GIS software packages, and has extensive functionality. A list of typical GIS capabilities is presented below, and these are all available in Maptitude.
Geographic analysis tools are the most valuable component of GIS software because they let you analyze the geographic components of your data. Below are some of the geographic analysis tools that are standard in Maptitude:
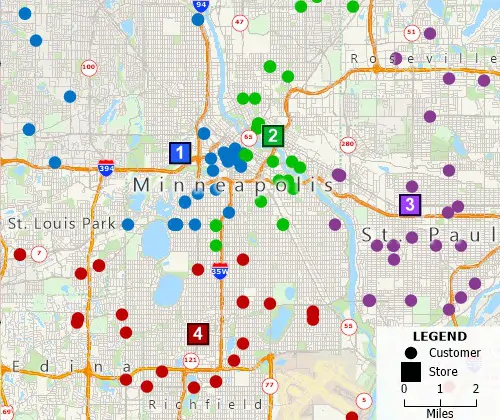
Territory Building Tools
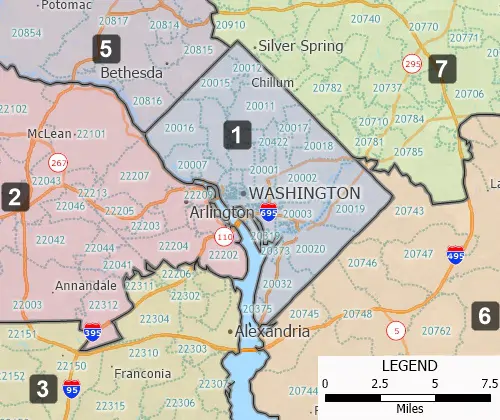
Districts/Territories can be created using map-based filters or via tabular groupings
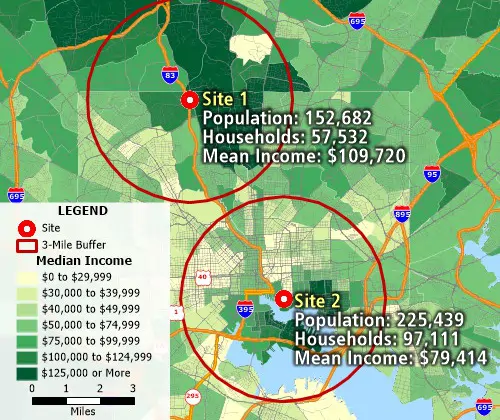
Buffers
Circular buffers/bands for analyzing proximity
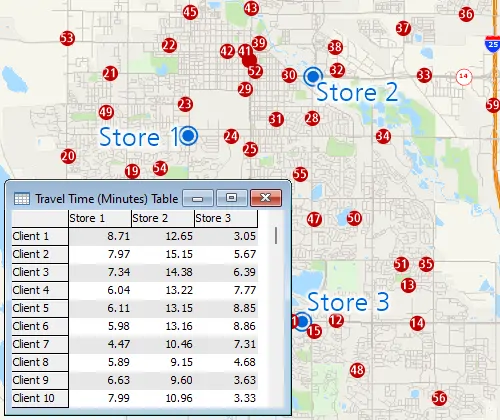
Facility Location
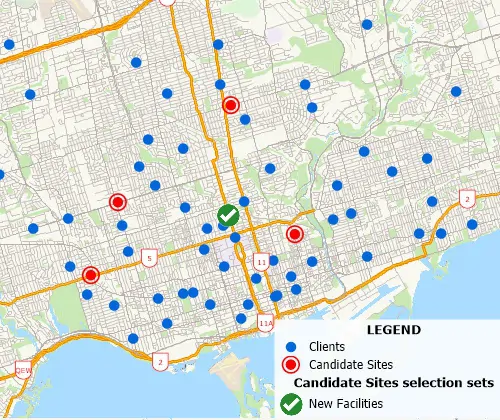
A facility location tool identifies the best location for one or more facilities from a set of candidate sites
Geographic Overlay
Geographic overlay/aggregation is supported and allows attribute assignment between layers based on percentage overlap for estimating demographics of territories, buffers, areas of influence, and more
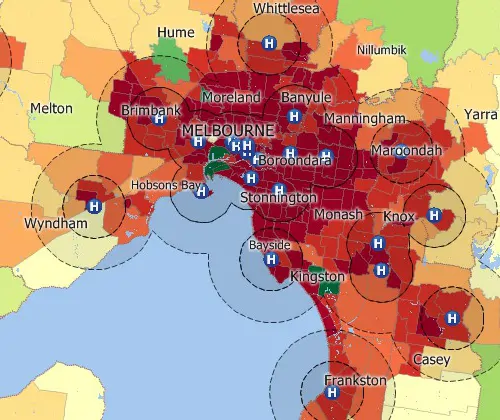
Hot Spots
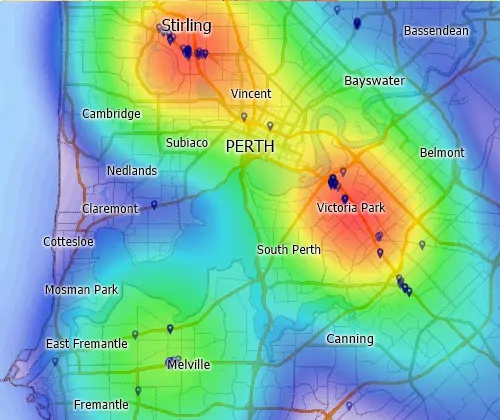
Kernel-based density grids can be created using the quartic, triangular, uniform, or count methods, and allow "hot-spot" mapping
Weighted Center
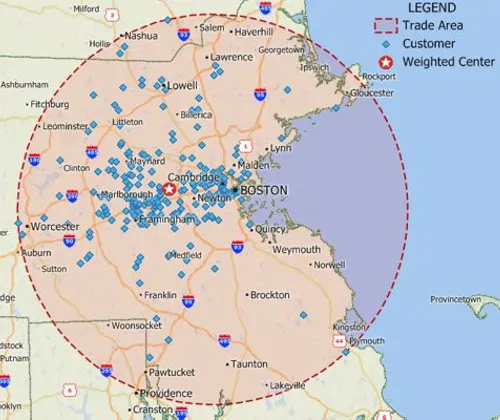
Weighted center calculations allow the identification of centers of "gravity" among points
Shortest Path
The shortest path calculations allow for minimizing the cost of the path as an ordered/unordered route with options to produce directions and to return to the origin
Drive-time Bands
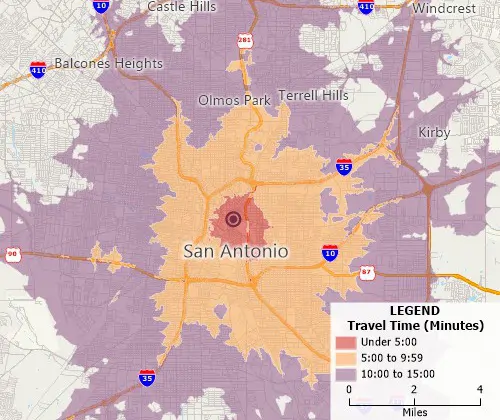
Drive time/distance bands allow you to visualize the extent to which locations can be accessed within a certain drive time or distance
Drive-time Territories
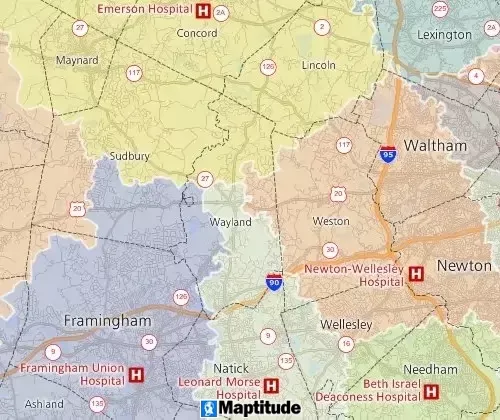
Drive time partitions allow regions across a line layer to be defined based on network cost
Clustering
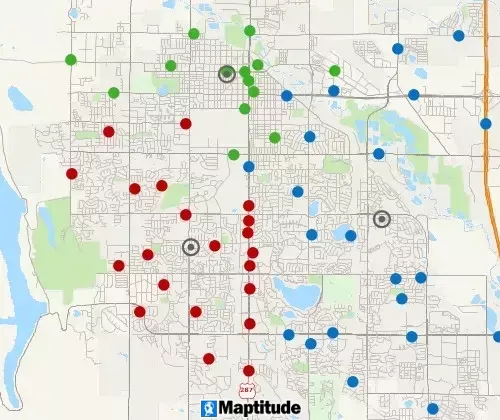
A clustering tool groups points or areas into compact clusters, while placing optional constraints on the clusters such as maximum size or a balanced total field, such as Sales or Population
Balancing
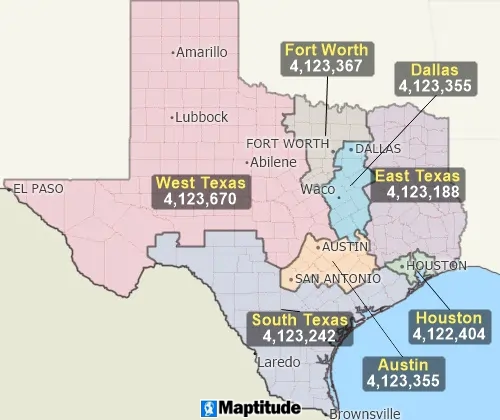
A balancing tool automatically creates territories that are balanced by a specific demographic
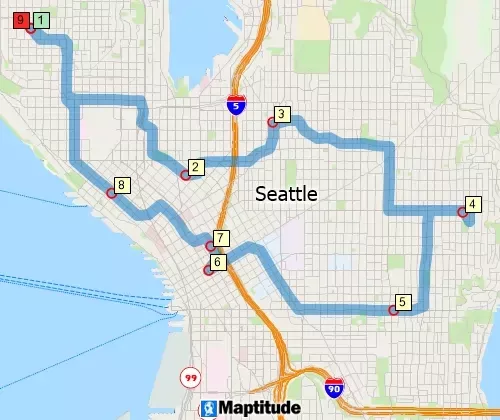
Routing Deliveries & Pickups
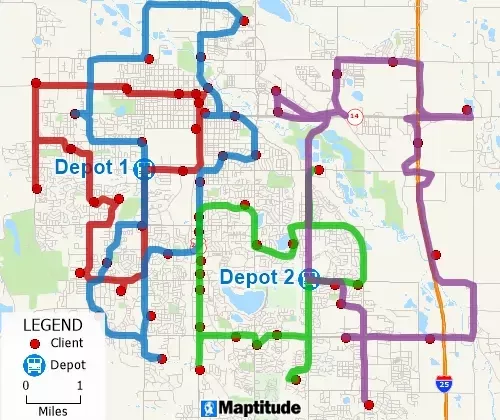
Routing tools optimize routes for several vehicles needing to reach many destinations for deliveries and pickups in fixed time windows
Measuring Tools
Length/area measurement tools allow map-based calculations
Desire Lines
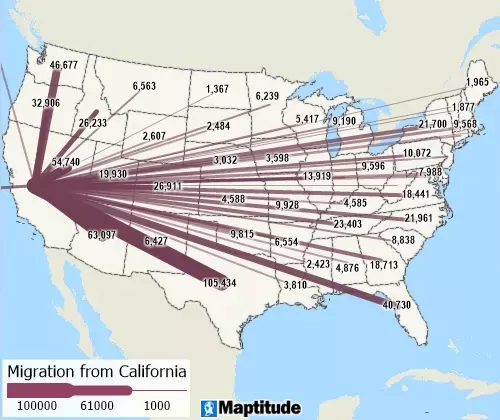
Desire lines (also known as spider diagrams) allow the visualization of flows
Surface Analysis
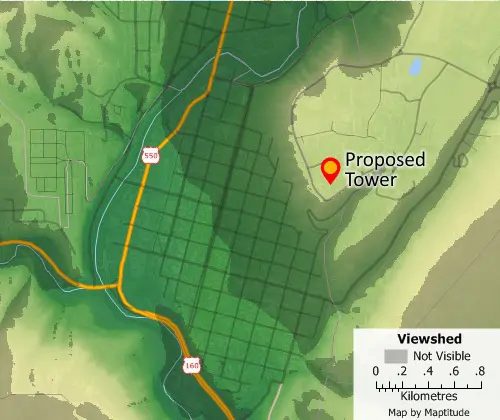
Surface analysis tools include spot height data querying, surface profiling, viewsheds, contouring, 3D terrain visualization, DEM/TIN creation, and the calculation of terrain shortest paths
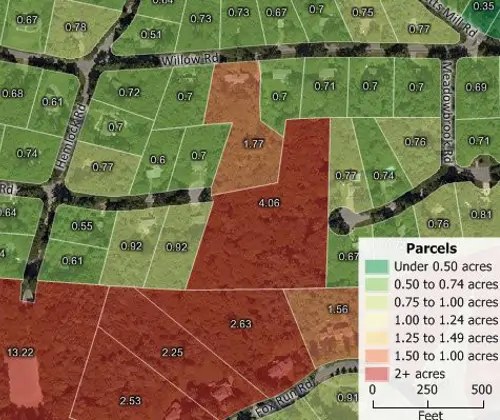
Data Classification
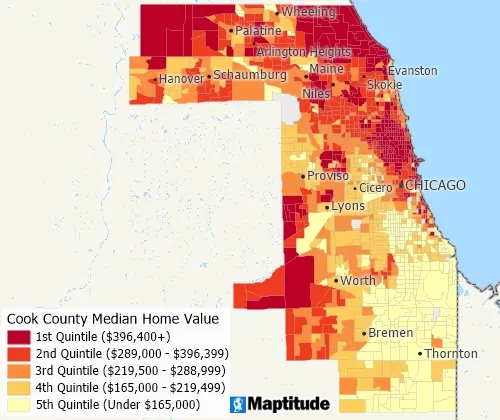
Data classification methods include: quantiles, equal weight, equal interval, standard deviation, nested means, arithmetic or geometric progression, Fisher-Jenks/optimal breaks, categories, and manual classification (by range, counts, or percentages)
Areas of Influence
Areas-of-Influence (also known as Thiessen Polygons or Voronoi Diagrams) are a powerful GIS tool that divide the study area using a triangulated irregular network (TIN)
GPS Support
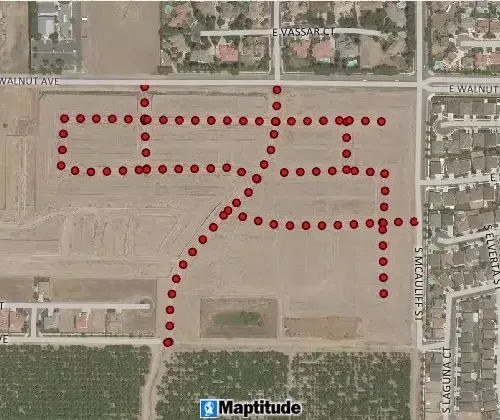
GPS support includes the ability to read/animate/import GPS data, overlay tracks with aerial photos and topographic or vector maps, track real time GPS locations, create vector line/point layers from GPS playback files, and import/export formats such as GPX (the GPS Exchange Format)
Spatial Queries
Filter features based on geographic location, proximity to other features, by radius, by pointing, by polygon, or based on a value or condition.
Statistical Analysis
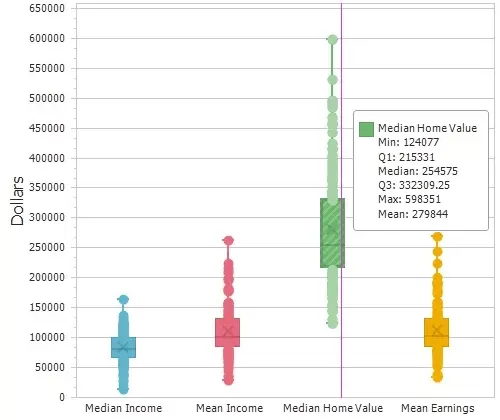
Compute summary statistics (sum, min, max, mean, standard deviation), compute spatial autocorrelation, and create box plots, histograms, and radar charts.
Internet Mapping
Map server products and Cloud and SaaS location-based applications such as Maptitude Online allow you to share your geographic data as device independent and mobile-friendly interactive maps. You can also add mapping functions to your web site such as providing the public with access to assessor parcel maps and valuation data.
Market Share (Huff Model)
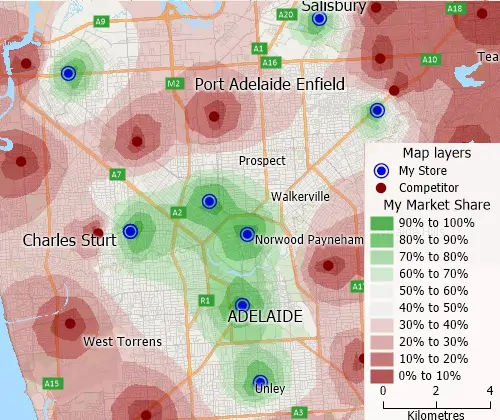
Market share analysis tools calculate your market share for an area by examining how attractive your stores are compared to all competing stores.
Land Use Analysis
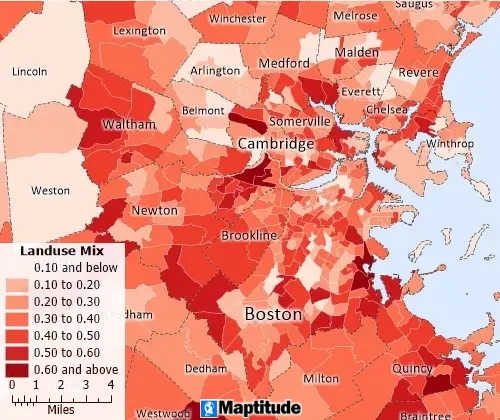
Accessibility measures of urban form to measure walkability and land use mix, to assess equitable access to services, amenities, and jobs.
Maptitude supports the latest 64-bit Windows operating systems, allowing users to take advantage of enhanced resolution and memory capabilities beyond the previous 4GB limit. This ensures the software is optimized for handling large GIS data files and spatial analysis tasks without performance loss.
Maptitude GIS mapping software costs $795 annually and includes a FREE country package ($695 value) that includes an up-to-date street layer with addresses for pin-mapping (geocoding) and travel time information for computing routes and drive-time rings. Also included are building footprints for many urban locations, railroads, and comprehensive named landmarks that range from public facilities to commercial buildings including shops, restaurants, and retail stores. Postal data and detailed demographics (where available) are shipped with the product.
|
Maptitude Reviews and Testimonials |
The GIS software industry offers a wide array of products, including commercial and open-source options across desktop, server, and cloud-based architectures.
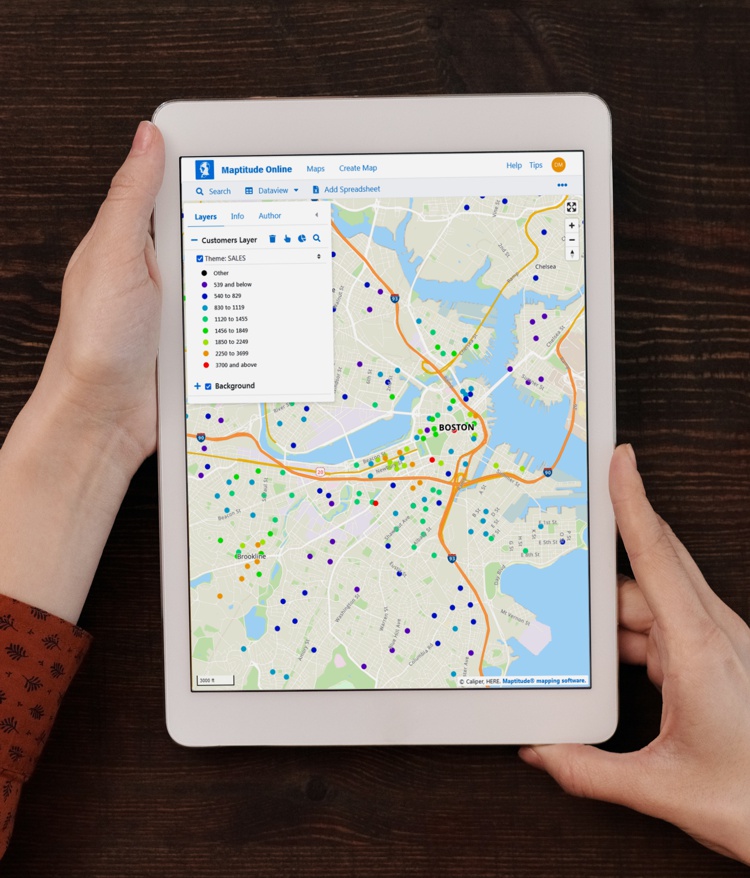
Maptitude Online GIS software provides powerful tools to create, manage, and share maps and reports securely. Administrators can control access with secure login options, and maps can be shared privately (with usernames and passwords) or publicly (via URL). Public maps can also be embedded into websites or blogs using simple HTML iframe code.
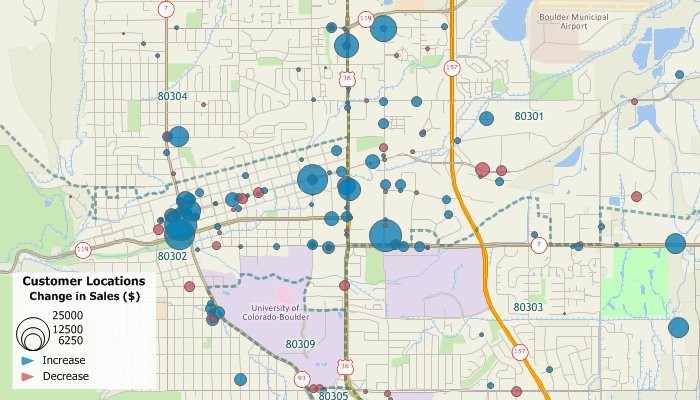
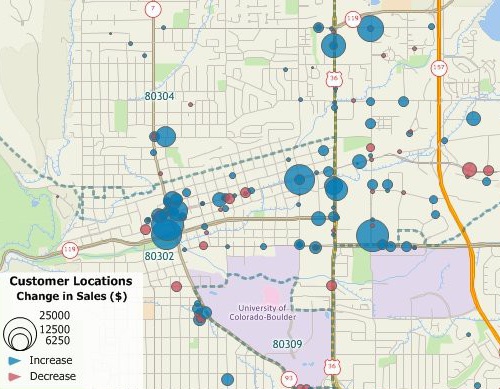
Data can be uploaded in Excel or CSV formats, or added by copying/pasting or typing in addresses. Batch geocoding is supported, and users can create dynamic visualizations such as heat maps, pie charts, and symbol or size-based themes. You can also add pushpins to addresses, ZIP Codes, and cities.
Maptitude offers a wide array of interactive geospatial tools, such as drawing radii, buffers, circles, territories, and drive-time rings. Maps can be tailored by adding, hiding, or removing layers, spreadsheets, themes, labels, and analytics.
With comprehensive help and learning materials, and competitively priced subscription plans, Maptitude Online makes professional GIS mapping accessible and effective for individuals, teams, and organizations.
Free Trial Request Demo Subscribe
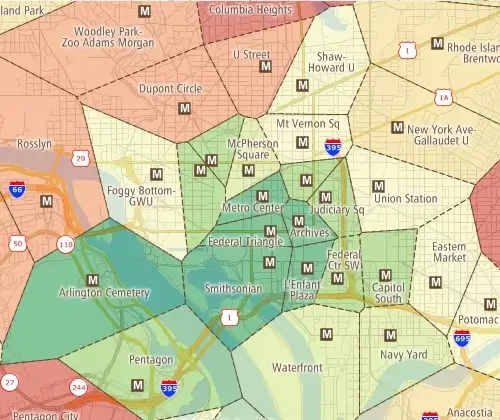
This interactive map lets you see the median income for U.S. ZIP Codes and proximity to major U.S. airports.
A Geographic Information System or GIS is a computer system that allows you to map, model, query, and analyze large quantities of data within a single database according to their location. GIS gives you the power to:
GIS is a tool used by individuals, organizations, schools, governments, and businesses seeking innovative ways to solve their problems. GIS stores information about the world as a collection of layers that can be linked together by a common locational component such as latitude and longitude, postal code, census tract, or street address. These geographic references allow you to locate features on the earth's surface for analysis of patterns and trends. Dozens of map layers can be arrayed to display information about transportation networks, hydrography, population characteristics, economic activity, and political jurisdictions enabling you to identify trends that may otherwise be hidden.
Geographic information system (GIS) technology can be used for spatial data analysis and mapping, enabling sophisticated applications in urban planning, environmental science, epidemiology, and natural resource management. Its capacity to integrate diverse datasets enhances decision-making and promotes a nuanced understanding of spatial patterns and relationships.
GIS is a tool used by individuals, organizations, schools, governments, and businesses seeking innovative ways to solve their problems. Some specific examples of GIS applications include:
The best GIS software is subjective and depends on the user's needs and preferences. There are a variety of GIS software available, including open source and proprietary options. Some of the most popular GIS software include ArcGIS, QGIS, Maptitude, Global Mapper, and MapInfo.
Maptitude mapping software is widely considered to be the best GIS software for businesses due to its comprehensive features, affordability, and ease of use. It enables users to create sophisticated maps and analyze spatial data in a variety of formats. Its user-friendly interface allows users to quickly learn and master the software without being a GIS professional. It also offers powerful tools for data analysis, such as tools for querying, mapping, and reporting. Maptitude also provides support for many popular GIS formats, such as ESRI Shapefiles, GeoTIFFs, and Google Earth KML/KMZ files. Furthermore, it offers a range of advanced tools for data visualization, including sales territory mapping and route planning and deliveries. All these features make Maptitude the best GIS software for businesses.
Free Trial Request Demo Subscribe
 Check out our G2 Reviews
Home | Products | Contact | Secure Store